December 03, 2025 a 03:15 amOXY: Trend and Support & Resistance Analysis - Occidental Petroleum Corporation


OXY: Trend and Support & Resistance Analysis - Occidental Petroleum Corporation
Occidental Petroleum Corporation engages in oil and gas property development across several key regions, offering a diversified business model. The latest technical analysis of OXY stock reveals a mixed trend with significant fluctuations in the price, influenced by market dynamics. The analysis includes essential moving average calculations to highlight potential trends in the market and identify support and resistance levels crucial for strategic decision-making.
Trend Analysis
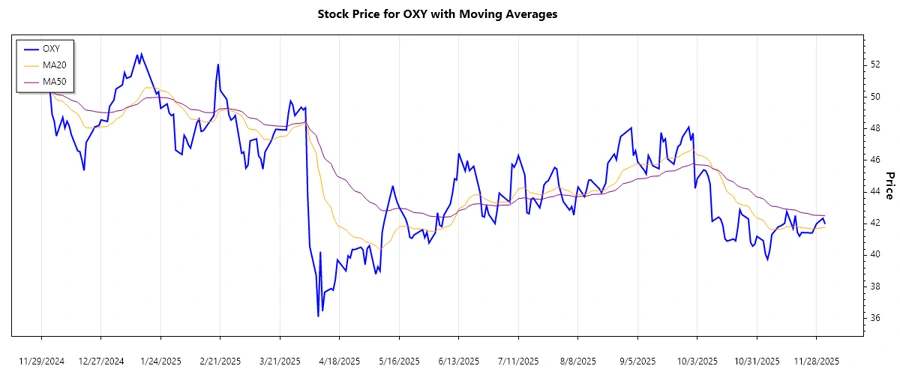
The technical trend analysis for Occidental Petroleum (OXY) reflects a recent downtrend over the observed period. Both the EMA20 and EMA50 are examined to determine the nature of the trend: a graphical representation is displayed below. We note significant price fluctuations that have resulted in trends of varying momentum:
| Date | Closing Price | Trend |
|---|---|---|
| 2025-12-02 | 41.98 | ▼ |
| 2025-12-01 | 42.34 | ▼ |
| 2025-11-28 | 42.00 | ▼ |
| 2025-11-26 | 41.42 | ▼ |
| 2025-11-25 | 41.41 | ▼ |
| 2025-11-24 | 41.43 | ▼ |
| 2025-11-21 | 41.44 | ▼ |
This dominant downtrend indicates a prevailing bearish mood amongst traders, as sell pressure continues to overshadow buying interest.
Support- and Resistance
Based on the analysis of previous price data, vital support and resistance zones have been identified. These zones are indicative of thresholds where significant buying or selling pressure might occur:
| Zone Type | From | To |
|---|---|---|
| Support | 40.00 | 41.00 |
| Support | 42.00 | 43.00 |
| Resistance | 45.00 | 47.00 |
| Resistance | 48.00 | 50.00 |
The current price of Occidental Petroleum (OXY) is found near the lower support zone, implying potential upward movement if the support holds.
Conclusion
The analysis highlights Occidental Petroleum’s stock as subject to a distinct downtrend, reflecting prevalent selling pressures. Support zones indicate potential bottom areas where buying interest might develop, signaling an impending price reversal if sustained. Conversely, resistance levels remain crucial overhead barriers to surpass for any meaningful bullish recovery. Market participants are advised to stay aware of these technical levels when strategizing their positions, keeping an eye on macroeconomic factors that could influence future price movements.