November 23, 2025 a 09:03 am
OXY: Trend and Support & Resistance Analysis - Occidental Petroleum Corporation
The recent analysis of Occidental Petroleum Corporation (OXY) shows fluctuations consistent with a market adapting to broader economic signals. As an oil and gas exploration and development company, OXY's stock performance is reflective of global oil prices and geopolitical factors. The technical analysis indicates a short-term movement within defined boundaries while maintaining a mid-term bearish tendency. Investors are advised to monitor support and resistance zones closely for potential entry or exit points.
Trend Analysis
| Date | Closing Price | Trend |
|---|---|---|
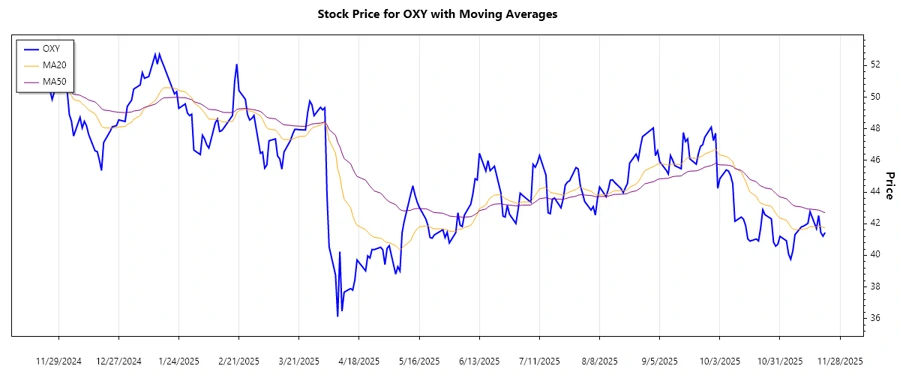
| 2025-11-21 | 41.44 | ▼ |
| 2025-11-20 | 41.21 | ▼ |
| 2025-11-19 | 41.45 | ▼ |
| 2025-11-18 | 42.52 | ▲ |
| 2025-11-17 | 41.69 | ▼ |
| 2025-11-14 | 42.76 | ▲ |
| 2025-11-13 | 42.02 | ▼ |
Based on the calculated EMAs, the current trend demonstrates a mild bearish signal as the EMA20 is less than EMA50, with recent upticks signaling potential reversals.
Support and Resistance Analysis
| Support & Resistance | Zone |
|---|---|
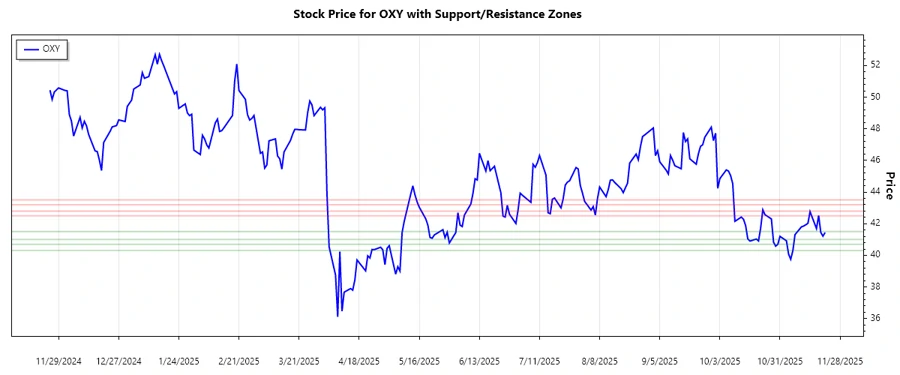
| Support Zone 1 | $41.00 - $41.50 |
| Support Zone 2 | $40.30 - $40.70 |
| Resistance Zone 1 | $42.50 - $42.80 |
| Resistance Zone 2 | $43.20 - $43.50 |
Currently, the stock is testing the upper levels of its established support zones. A breach above or below these levels could indicate stronger price movement in either direction.
Conclusion
The Occidental Petroleum Corporation (OXY) stock is navigating through critical support and resistance zones, capturing attention for potential trading opportunities. Recent patterns depict a struggling recovering trend, emphasizing volatility influenced by external economic factors. While support levels present short-term stabilization, significant resistance areas pose challenges for upward momentum. Analysts should observe oil market dynamics closely, as well as global economic conditions which could rapidly alter the current trajectory and risk landscape. For investors, strategic analysis and adaptive positioning remain crucial for capitalizing on OXY's market movements.
Smart Data Insight
Master the Perfect Entry & Exit for this Stock
Don't leave your profits to chance. Historically, this stock follows specific seasonal patterns that institutional traders use to maximize returns.
- ✅ Identify the "Golden Buying Window"
- ✅ Avoid high-risk correction cycles
- ✅ Backtested data from the last 20+ years