July 16, 2025 a 09:04 am


OXY: Trend and Support & Resistance Analysis - Occidental Petroleum Corporation
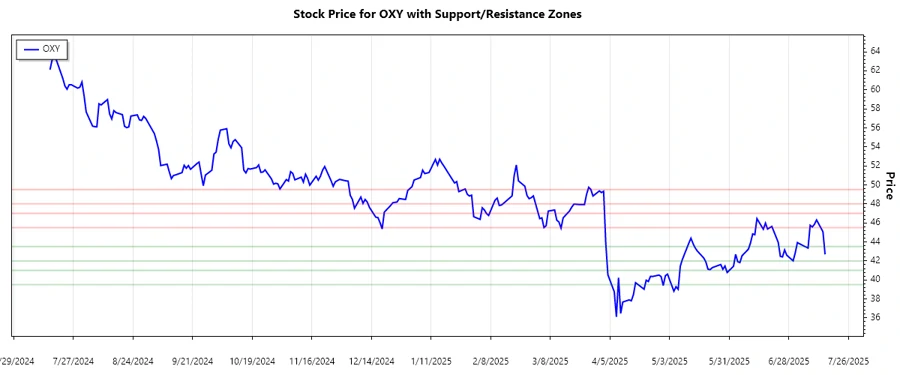
Occidental Petroleum Corporation, operating primarily in oil and gas acquisition, exploration, and development, has seen varied stock performance. Over recent months, OXY's price fluctuations reflect broader industry trends and company-specific developments. The current analysis aims to interpret technical movements such as trends and support or resistance zones. These factors can significantly influence investor decision-making and strategy formulation.
Trend Analysis
| Date | Close Price | Trend |
|---|---|---|
| 2025-07-15 | 42.69 | ▼ |
| 2025-07-14 | 45.07 | ▲ |
| 2025-07-11 | 46.31 | ▲ |
| 2025-07-10 | 45.85 | ▼ |
| 2025-07-09 | 45.57 | ▼ |
| 2025-07-08 | 45.75 | ▲ |
| 2025-07-07 | 43.35 | ▼ |
The calculated EMA20 (44.37) is currently less than EMA50 (46.83), indicating a prevailing downward trend in Occidental Petroleum Corporation's stock. This persistence of lower averages suggests a bearish sentiment, impacting potential trading strategies.
Support- and Resistance
| Type | Zone |
|---|---|
| Support | 39.50 ➜ 41.00 |
| Support | 42.00 ➜ 43.50 |
| Resistance | 45.50 ➜ 47.00 |
| Resistance | 48.00 ➜ 49.50 |
The current price of 42.69 sits close to the intermediate support zone (42.00 ➜ 43.50), highlighting potential buying interest near these levels. If the price sustains above this zone, it may challenge overhead resistances of 45.50 ➜ 47.00 in the near term. Technical confirmation is necessary for any sustained breakout or breakdown.
Conclusion
Occidental Petroleum Corporation's stock trend analysis currently points towards a bearish trend. The presence of support and resistance zones could influence short-term price movements, particularly for traders seeking strategic entry or exit points. While the stock is near support, any upward movement requires surpassing resistance zones to confirm a trend reversal. In contrast, breaking below the support could catalyze further declines. Investors should be cautious and observe technical signals alongside fundamental analysis to refine trading perspectives.
Smart Data Insight
Master the Perfect Entry & Exit for this Stock
Don't leave your profits to chance. Historically, this stock follows specific seasonal patterns that institutional traders use to maximize returns.
- ✅ Identify the "Golden Buying Window"
- ✅ Avoid high-risk correction cycles
- ✅ Backtested data from the last 20+ years