
June 24, 2026 a 11:43 am
OXY: Fundamental Ratio Analysis - Occidental Petroleum Corporation
Occidental Petroleum Corporation (OXY) continues to show a strong performance in the energy sector, with a stable history of exploration and production. Investors should consider the company's resilience amidst fluctuating oil prices, alongside its strategic investments in midstream and marketing operations. Established in 1920, Occidental remains a key player in both U.S. and international oil markets.
Fundamental Rating
Occidental Petroleum exhibits solid fundamentals with an overall score of 4, rated A-. Key areas such as discounted cash flow, return on equity, and return on assets reveal robust profitability and growth prospects.
| Category | Score | Visual |
|---|---|---|
| Discounted Cash Flow | 4 | |
| Return on Equity | 4 | |
| Return on Assets | 4 | |
| Debt to Equity | 3 | |
| Price to Earnings | 2 | |
| Price to Book | 3 |
Historical Rating
The historical performance metrics provide insight into Occidental Petroleum's consistent financial health over time.
| Date | Overall | DCF | ROE | ROA |
|---|---|---|---|---|
| 2026-06-23 | 4 | 4 | 4 | 4 |
| [Past Date] | 0 | 4 | 4 | 4 |
Analyst Price Targets
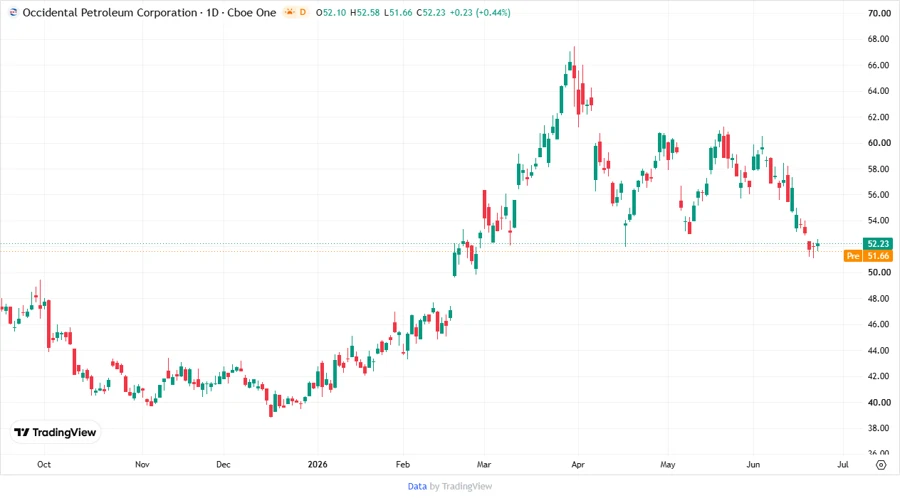
The analyst consensus for Occidental Petroleum indicates a balanced outlook with a price target consensus of 62.31 USD, offering potential growth.
| High | Low | Median | Consensus |
|---|---|---|---|
| 75 | 45 | 64 | 62.31 |
Analyst Sentiment
Analysis of analyst sentiment reveals a predominantly positive stance, with most ratings leaning towards 'Buy'.
| Recommendation | Count | Visual |
|---|---|---|
| Strong Buy | 0 | |
| Buy | 25 | |
| Hold | 23 | |
| Sell | 4 | |
| Strong Sell | 0 |
Conclusion
Occidental Petroleum Corporation remains a formidable player in the oil and gas industry with notable strengths in its financial and operational metrics. The firm has shown resilience amidst volatile market conditions, making it an attractive prospect for potential investors. However, challenges in global energy demand and regulatory landscapes could pose risks. Overall, the company's strategic initiatives and strong industry position suggest positive future performance.
Smart Data Insight
Master the Perfect Entry & Exit for this Stock
Don't leave your profits to chance. Historically, this stock follows specific seasonal patterns that institutional traders use to maximize returns.
- ✅ Identify the "Golden Buying Window"
- ✅ Avoid high-risk correction cycles
- ✅ Backtested data from the last 20+ years