May 15, 2026 a 11:44 am
OXY: Fibonacci Analysis - Occidental Petroleum Corporation
The Occidental Petroleum Corporation stock (Ticker: OXY) has been experiencing a significant downtrend over the past months. This trend presents both potential buying opportunities and risks for investors. While the recent dip may signal a bottoming pattern, further confirmation is necessary. Investors should watch for price stabilization and increased buying volume as signs of a potential trend reversal. Overall, OXY offers an opportunity for gains if the trend shifts but also poses risks if the downtrend continues.
Fibonacci Analysis
| Attribute | Value |
|---|---|
| Trend Start Date | 2026-03-30 |
| Trend End Date | 2026-05-14 |
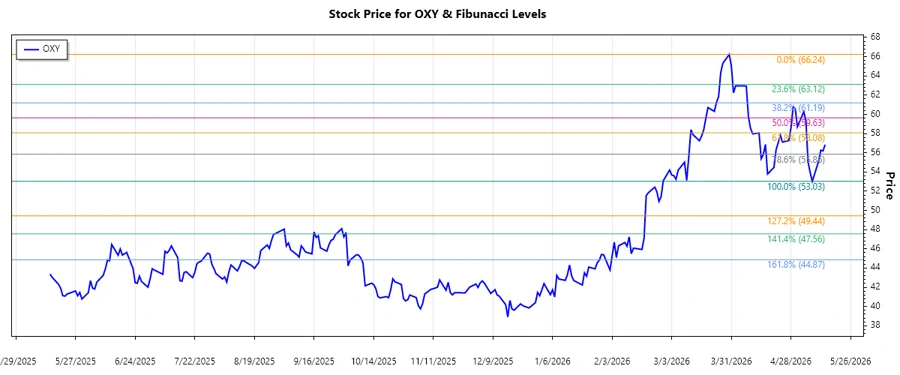
| High Price (Date) | $66.24 (2026-03-30) |
| Low Price (Date) | $53.03 (2026-05-08) |
| Fibonacci 0.236 Level | $56.79 |
| Fibonacci 0.382 Level | $58.40 |
| Fibonacci 0.5 Level | $59.64 |
| Fibonacci 0.618 Level | $60.89 |
| Fibonacci 0.786 Level | $62.61 |
| Current Price | $56.84 |
| Retracement Zone | 0.236 |
| Technical Interpretation | The current price is at the 0.236 retracement level, which may act as a support level. A break below could indicate further downside risk, while a rebound could signal a trend reversal. |
Conclusion
Occidental Petroleum Corporation's stock has been in a noticeable downtrend recently, marking potential opportunities for value investors willing to withstand volatility. The stock's current positioning at the 0.236 Fibonacci retracement level is critical; it could support a reversal or indicate more downside. Analysts should closely monitor volume changes and support levels for shifts in market sentiment. While current levels suggest possible gains on trend reversal, caution is advised due to potential for continuing declines. Overall, the stock offers intriguing but risky prospects in the near term.
Smart Data Insight
Master the Perfect Entry & Exit for this Stock
Don't leave your profits to chance. Historically, this stock follows specific seasonal patterns that institutional traders use to maximize returns.
- ✅ Identify the "Golden Buying Window"
- ✅ Avoid high-risk correction cycles
- ✅ Backtested data from the last 20+ years