September 28, 2025 a 05:15 am
OXY: Fibonacci Analysis - Occidental Petroleum Corporation
Occidental Petroleum Corporation has shown a dynamic performance heavily influenced by oil and gas market conditions. The stock has experienced fluctuations based on geopolitical factors and internal production changes. Its diverse market segments could provide resilience against sector-specific downturns, although oil price volatility remains a key risk factor for its valuation.
Fibonacci Analysis
| Details | Information |
|---|---|
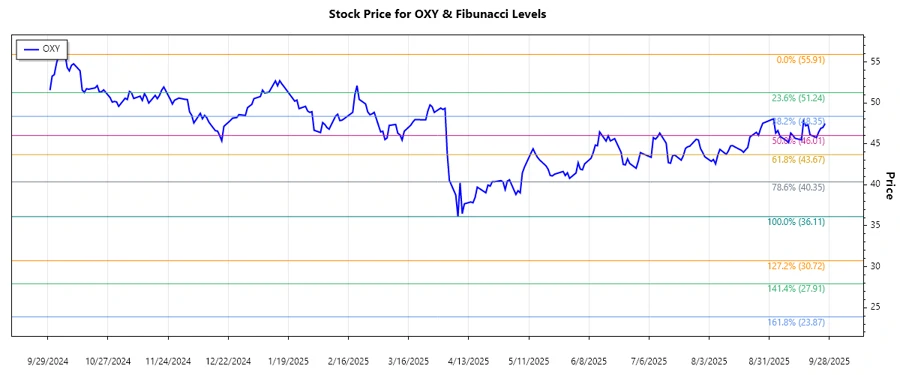
| Trend Period | 2024-10-01 to 2025-09-26 |
| Highest Price | $55.91 on 2024-10-07 |
| Lowest Price | $36.11 on 2025-04-08 |
| Fibonacci Retracement Level | Price Level |
|---|---|
| 0.236 | $41.36 |
| 0.382 | $45.55 |
| 0.500 | $46.01 |
| 0.618 | $50.12 |
| 0.786 | $52.42 |
The current price of $47.47 sits near the 0.5 Fibonacci level, indicating a potential support zone. This suggests that the stock may find stability around this level, offering an opportunity for potential long positions.
Conclusion
Occidental Petroleum's stock has exhibited a significant downtrend from its October 2024 highs, followed by a recovery attempt in 2025. The proximity to the 0.5 Fibonacci level suggests possible technical support, which might attract bullish positions. However, the broader market context and oil price trends will play critical roles in determining future movements. Investors should weigh potential geopolitical and OPEC-related influences while considering Occidental's broad operational footprint as a mitigating factor against sector-specific risks.
Smart Data Insight
Master the Perfect Entry & Exit for this Stock
Don't leave your profits to chance. Historically, this stock follows specific seasonal patterns that institutional traders use to maximize returns.
- ✅ Identify the "Golden Buying Window"
- ✅ Avoid high-risk correction cycles
- ✅ Backtested data from the last 20+ years