September 25, 2025 a 06:45 am
OXY: Fibonacci Analysis - Occidental Petroleum Corporation
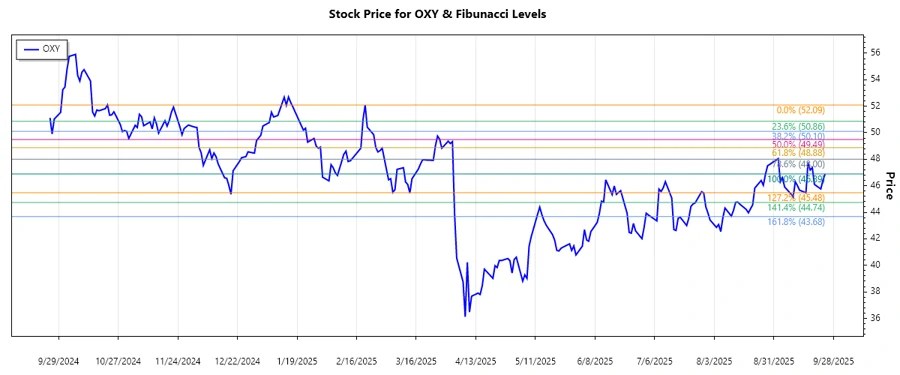
Occidental Petroleum Corporation has shown resilience in the energy sector, adapting to market conditions with its diversified business segments. The recent data suggests a predominant trend that investors should consider for future trading decisions. Understanding the technical signals in OXY's performance could provide opportunities for strategic positioning.
Fibonacci Analysis
| Parameter | Details | ||||||||||||
|---|---|---|---|---|---|---|---|---|---|---|---|---|---|
| Trend Type | Downward | ||||||||||||
| Start Date | 2025-02-20 | ||||||||||||
| End Date | 2025-09-24 | ||||||||||||
| High Point | $52.09 (2025-02-20) | ||||||||||||
| Low Point | $46.89 (2025-09-24) | ||||||||||||
| Fibonacci Levels |
|
||||||||||||
| Retracement Zone | 0.236 | ||||||||||||
| Technical Interpretation | The current retracement suggests potential resistance around the 0.236 level. A break above could indicate strength; conversely, failure to break could reinforce the bearish trend. |
Conclusion
The recent downward trend in Occidental Petroleum’s stock suggests potential bearish conditions in the short term, with significant influence from broader market energy prices. However, the retracement levels provide critical signals for potential support and resistance areas. Investors should monitor the 0.236 Fibonacci level closely, as breaking this could signal a potential shift in sentiment. Technical traders might see this as an opportunity for short-term strategies or potential entry points. The volatility in the energy sector, compounded by geopolitical factors, presents both significant opportunities and risks for stakeholders.
Smart Data Insight
Master the Perfect Entry & Exit for this Stock
Don't leave your profits to chance. Historically, this stock follows specific seasonal patterns that institutional traders use to maximize returns.
- ✅ Identify the "Golden Buying Window"
- ✅ Avoid high-risk correction cycles
- ✅ Backtested data from the last 20+ years