June 02, 2026 a 02:46 am


OXY: Dividend Analysis - Occidental Petroleum Corporation
Occidental Petroleum Corporation demonstrates a strong long-term dividend history, with a track record indicating resilience and commitment to its shareholders. However, recent years have seen fluctuating dividend growth rates, highlighting a need for cautious optimism. Overall, Occidental's robust market position and strategic business operations make it a noteworthy contender for dividend-focused portfolios.
📊 Overview
Occidental Petroleum operates in the Energy sector, with a modest dividend yield providing income to shareholders. The continuous dividend history of 45 years is notable, although recent yield and growth values suggest caution.
| Sector | Dividend Yield (%) | Current Dividend per Share (USD) | Dividend History (Years) | Last Cut or Suspension |
|---|---|---|---|---|
| Energy | 1.70 | 1.63 | 45 | None |
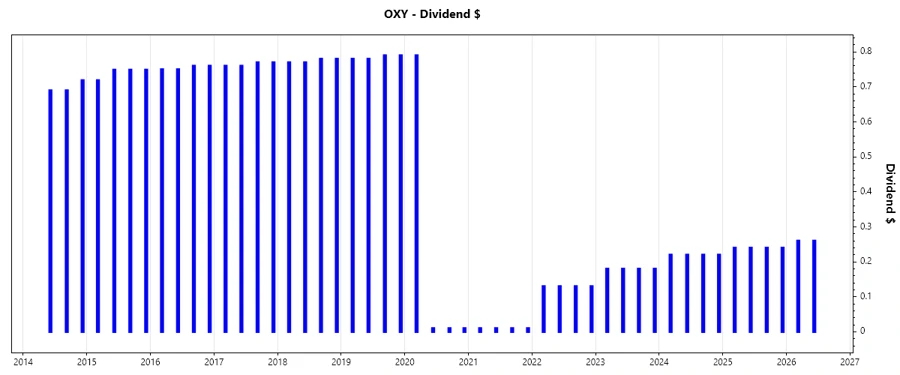
🗣️ Dividend History
The historical performance of dividends is a critical indicator of financial stability and shareholder value. Occidental Petroleum's long dividend history demonstrates a sustained commitment, though recent payouts average lower than previous decades.
| Year | Dividend per Share (USD) |
|---|---|
| 2026 | 0.52 |
| 2025 | 0.96 |
| 2024 | 0.88 |
| 2023 | 0.72 |
| 2022 | 0.52 |
📈 Dividend Growth
Dividend growth acts as a testament to a company's increasing profitability and shareholder reward. Recent figures suggest a deceleration in growth, with a 5-year average of just 0.03% and a slight uptick on a 3-year scale at approximately 0.23%.
| Time | Growth (%) |
|---|---|
| 3 years | 0.23% |
| 5 years | 0.03% |
The average dividend growth is 0.03% over 5 years. This shows moderate but steady dividend growth.
✅ Payout Ratio
Analyzing the payout ratio provides insights into dividend sustainability. Occidental Petroleum's payout ratio indicates a balanced approach, with 33.86% based on EPS and 45.56% on free cash flow. This suggests a secure and manageable dividend policy.
| Key Figure | Ratio (%) |
|---|---|
| EPS-based | 33.86 |
| Free Cash Flow-based | 45.56 |
These figures convey that the EPS-based ratio, at 33.86%, is favorable for sustainable dividend distribution, complemented by a slightly higher but acceptable FCF ratio. This supports a consistent payout approach.
Cashflow & Capital Efficiency
The cash flow position and capital efficiency are pivotal in assessing the financial health of Occidental. Strong free cash flow and earnings yield underpin capital investment and shareholder returns.
| Metric | 2023 | 2024 | 2025 |
|---|---|---|---|
| Free Cash Flow Yield | 11.42% | 9.81% | 10.23% |
| Earnings Yield | 8.80% | 6.75% | 5.91% |
| CAPEX to Operating Cash Flow | 50.74% | 61.35% | 61.02% |
| Stock-based Compensation to Revenue | 0.00% | 0.84% | 0.00% |
| Free Cash Flow / Operating Cash Flow Ratio | 49.26% | 38.65% | 38.98% |
The cash flow trends show reliable stability, enhancing Occidental’s capacity for sustained capital investment and dividend distribution.
Balance Sheet & Leverage Analysis
Examining debt and leverage is crucial in determining Occidental's financial resilience. Moderate debt metrics with strong interest coverage ratios highlight manageable obligations and sound financial health.
| Metric | 2023 | 2024 | 2025 |
|---|---|---|---|
| Debt-to-Equity | 0.69 | 0.79 | 0.66 |
| Debt-to-Assets | 0.28 | 0.32 | 0.28 |
| Debt-to-Capital | 0.41 | 0.44 | 0.40 |
| Net Debt to EBITDA | 1.34 | 1.96 | 1.93 |
| Current Ratio | 0.92 | 0.95 | 0.94 |
| Quick Ratio | 0.69 | 0.73 | 0.74 |
| Financial Leverage | 2.45 | 2.50 | 2.41 |
Overall, Occidental maintains a stable debt structure, ensuring operational flexibility in financial commitments.
Fundamental Strength & Profitability
Analyzing fundamental metrics provides insights into operational efficiency and profitability. Positive returns on equity and assets reflect sound performance and shareholder value enhancement.
| Metric | 2023 | 2024 | 2025 |
|---|---|---|---|
| Return on Equity | 15.45% | 8.91% | 6.57% |
| Return on Assets | 6.31% | 3.56% | 2.73% |
| Margins: Net | 16.49% | 11.23% | 10.97% |
| EBIT Margin | 26.03% | 19.35% | 17.24% |
| EBITDA Margin | 51.31% | 46.95% | 52.63% |
| Gross Margin | 34.39% | 35.61% | 33.78% |
| R&D to Revenue | 0.00% | 0.00% | 0.00% |
Occidental's profitability remains robust, underpinned by efficient resource allocation and market adaptability.
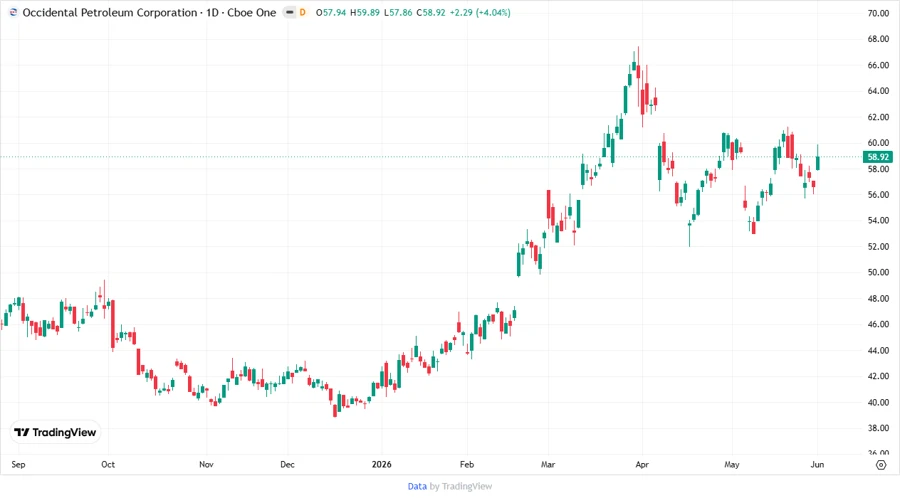
Price Development
Dividend Scoring System
| Category | Score | Indicator |
|---|---|---|
| Dividend Yield | 3 | |
| Dividend Stability | 4 | |
| Dividend Growth | 2 | |
| Payout Ratio | 5 | |
| Financial Stability | 4 | |
| Dividend Continuity | 5 | |
| Cashflow Coverage | 4 | |
| Balance Sheet Quality | 4 |
Overall Score: 31/40
Rating
Occidental Petroleum Corporation, with its longstanding dividend history and sound financial practices, offers a compelling option for dividend-focused investors. While some metrics highlight risks, the overall analysis underscores a strong dividend payment tradition. Investors seeking stability with moderate growth potential may find OXY a prudent addition to their portfolio.
Smart Data Insight
Master the Perfect Entry & Exit for this Stock
Don't leave your profits to chance. Historically, this stock follows specific seasonal patterns that institutional traders use to maximize returns.
- ✅ Identify the "Golden Buying Window"
- ✅ Avoid high-risk correction cycles
- ✅ Backtested data from the last 20+ years