April 29, 2026 a 07:46 am
OXY: Dividend Analysis - Occidental Petroleum Corporation
Occidental Petroleum Corporation presents a compelling dividend profile with a strong history of payments despite recent fluctuations. The company's market position in the energy sector supports its ability to sustain and potentially grow dividends, albeit with caution due to market volatility and industry regulations. Investors seeking consistent income might consider OXY for its dividend history, although keeping a watchful eye on the payout stability and growth is advised.
📊 Overview
Occidental Petroleum has demonstrated a sturdy position in the energy sector with a substantial dividend yield and a long history of dividend payments. The recent figures are indicative of its strategic efforts to maintain shareholder value through dividends.
| Metric | Value |
|---|---|
| Sector | Energy |
| Dividend yield | 1.84% |
| Current dividend per share | 1.63 USD |
| Dividend history | 45 years |
| Last cut or suspension | None |
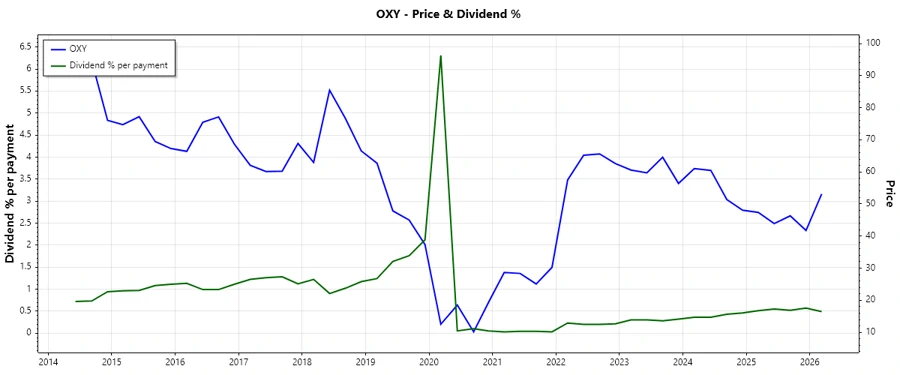
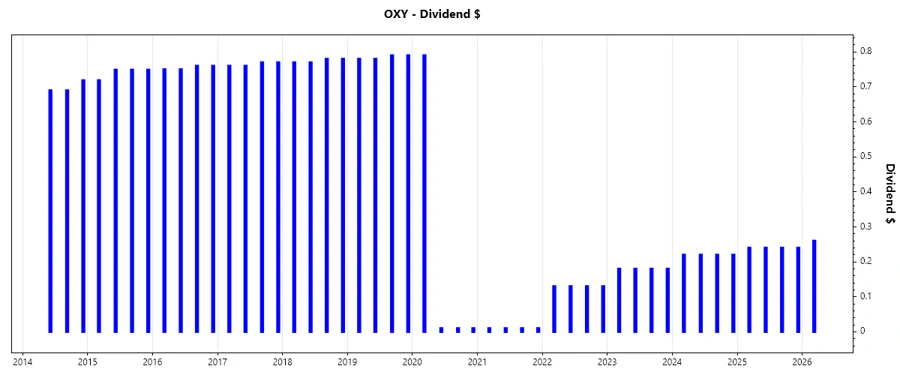
🔍 Dividend History
The company's dividend history illustrates resilience and a commitment to rewarding shareholders, with interruptions primarily due to macroeconomic pressures. Investors value this long-term consistency, providing a sense of security and predictability.
| Year | Dividend per Share (USD) |
|---|---|
| 2026 | 0.26 |
| 2025 | 0.96 |
| 2024 | 0.88 |
| 2023 | 0.72 |
| 2022 | 0.52 |
📈 Dividend Growth
The analysis of dividend growth showcases a strategy favoring sustainability over aggressive expansion. Investors should note the modest pace of growth indicative of stable but cautious fiscal management.
| Time | Growth |
|---|---|
| 3 years | 0.23% |
| 5 years | 0.03% |
The average dividend growth is 0.03% over 5 years. This shows moderate but steady dividend growth.
⚠️ Payout Ratio
Payout ratios are crucial indicators of dividend sustainability. OXY's ratios suggest a balanced approach to maintaining dividends whilst managing operating expenditures.
| Key figure | Ratio |
|---|---|
| EPS-based | 70.38% |
| Free cash flow-based | 39.48% |
The EPS payout ratio at 70.38% implies a higher subscription of earnings towards dividends. The FCF payout ratio, being significantly lower at 39.48%, indicates a sound capacity to cover dividends, ensuring future payouts are relatively secure.
💰 Cashflow & Capital Efficiency
Cash flow and capital efficiency metrics are paramount in assessing a company's financial health and ability to fund dividend distributions effectively.
| Year | 2025 | 2024 | 2023 |
|---|---|---|---|
| Free Cash Flow Yield | 10.23% | 9.81% | 11.42% |
| Earnings Yield | 5.91% | 6.75% | 8.80% |
| CAPEX to Operating Cash Flow | 61.02% | 61.35% | 50.74% |
| Stock-based Compensation to Revenue | 0% | 0.84% | 0% |
| Free Cash Flow / Operating Cash Flow Ratio | 38.98% | 38.65% | 49.26% |
The cash flow stability and capital efficiency are reflective of OXY's tactical investments and robust management practices that support shareholder distributions and capitalize on market opportunities.
💼 Balance Sheet & Leverage Analysis
Leverage metrics offer insight into Occidental's financial resilience and risk profile, as these influence its capacity to finance its dividends and operations.
| Year | 2025 | 2024 | 2023 |
|---|---|---|---|
| Debt-to-Equity | 0.665 | 0.793 | 0.691 |
| Debt-to-Assets | 0.276 | 0.317 | 0.283 |
| Debt-to-Capital | 0.399 | 0.442 | 0.409 |
| Net Debt to EBITDA | 1.93x | 1.96x | 1.34x |
| Current Ratio | 0.936 | 0.953 | 0.916 |
| Quick Ratio | 0.743 | 0.733 | 0.694 |
| Financial Leverage | 2.408 | 2.501 | 2.447 |
The balance sheet strength is visible through moderate leverage ratios, providing Occidental with flexibility to navigate fiscal obligations while preserving shareholder returns.
🏢 Fundamental Strength & Profitability
Occidental Petroleum's profitability ratios illustrate its operational efficiency and ability to generate shareholder wealth amidst fluctuating market conditions.
| Year | 2025 | 2024 | 2023 |
|---|---|---|---|
| Return on Equity | 6.57% | 8.91% | 15.45% |
| Return on Assets | 2.73% | 3.56% | 6.31% |
| Margins: Net | 10.97% | 11.23% | 16.49% |
| Margins: EBIT | 17.24% | 19.35% | 26.03% |
| Margins: EBITDA | 52.63% | 46.95% | 51.31% |
| Margins: Gross | 33.78% | 35.61% | 34.39% |
| Research & Development to Revenue | 0% | 0% | 0% |
The robust profitability metrics showcase Occidental's adeptness in extracting value and returning capital to investors, all while maintaining efficient operational budgets.
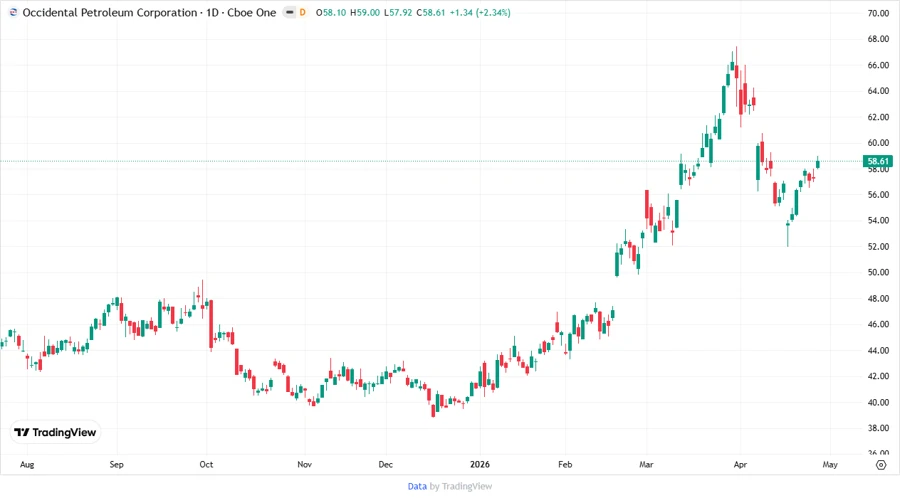
📉 Price Development
✅ Dividend Scoring System
| Category | Score | % |
|---|---|---|
| Dividend yield | 2 | |
| Dividend Stability | 4 | |
| Dividend growth | 2 | |
| Payout ratio | 4 | |
| Financial stability | 3 | |
| Dividend continuity | 5 | |
| Cashflow Coverage | 3 | |
| Balance Sheet Quality | 3 |
Total Score: 26/40
🔍 Rating
Occidental Petroleum Corporation's dividend profile reveals a company committed to long-term shareholder returns amidst market cyclicality. The combination of stable dividend history and prudent payout ratios positions the company as a potential candidate for dividend-seeking investors. However, investors should continuously review financial health indicators to ensure sustained dividend viability, especially given industry volatility.