April 08, 2026 a 02:46 am
OXY: Dividend Analysis - Occidental Petroleum Corporation
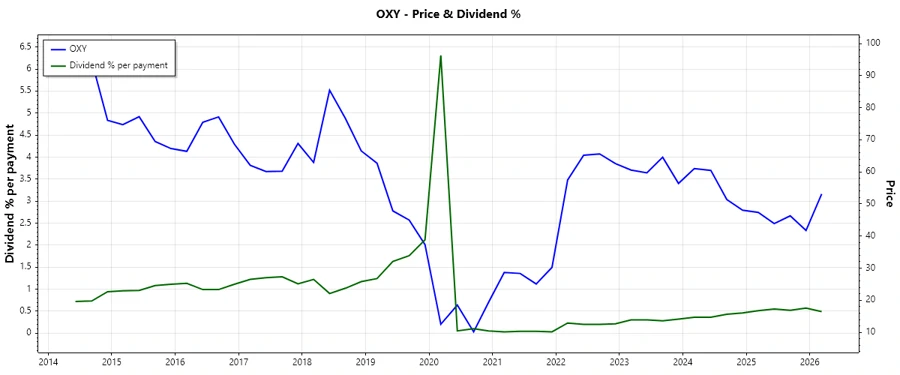
Occidental Petroleum Corporation has been a staple in the energy sector, showcasing a robust 45-year history of dividend payments. This commitment to rewarding shareholders is underscored by a dividend yield of 1.84% and a current dividend per share of $1.63. With no recent cuts or suspensions, Occidental demonstrates a stable payout approach, although the dividend growth remains conservative.
📊 Overview
Occidental Petroleum Corporation operates within the energy sector, ensuring a steady dividend yield of 1.84%. This yield, while modest compared to industry peers, reflects a resilient approach to dividend payments over time, with a current dividend per share of $1.63. The company has maintained a commendable dividend history spanning 45 years, with no recent cuts, indicating strong financial discipline.
| Sector | Dividend Yield (%) | Current Dividend per Share (USD) | Dividend History (Years) | Last Cut or Suspension |
|---|---|---|---|---|
| Energy | 1.85 | 1.63 | 45 | None |
🗣️ Dividend History
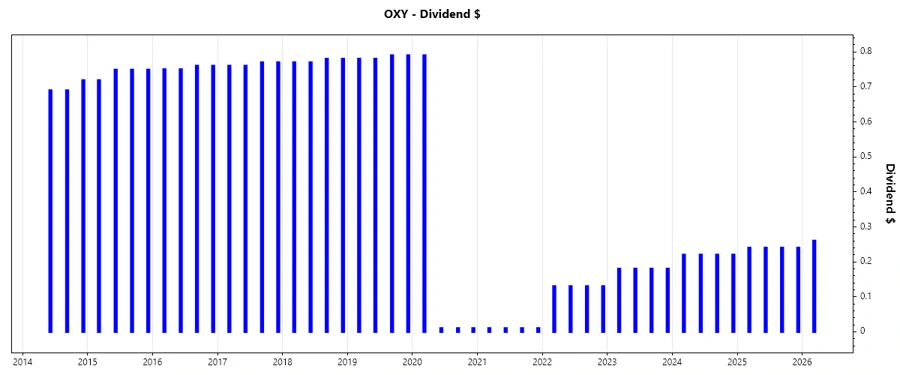
The significance of Occidental Petroleum's dividend history cannot be overstated, as it showcases a commitment to shareholders despite market volatilities. Analyzing their dividend payments over recent years provides insights into their strategic stability and future prospects.
| Year | Dividend per Share (USD) |
|---|---|
| 2026 | 0.26 |
| 2025 | 0.96 |
| 2024 | 0.88 |
| 2023 | 0.72 |
| 2022 | 0.52 |
📈 Dividend Growth
Examining Occidental Petroleum's dividend growth reveals modest improvements that are crucial for evaluating long-term shareholder returns. Over the last 3 years, dividends have grown by 22.67%, while the 5-year growth stands at 3.20%. These figures illustrate the company's conservative but consistent approach to enhancing shareholder value.
| Time | Growth (%) |
|---|---|
| 3 years | 22.67 |
| 5 years | 3.20 |
The average dividend growth is 3.20% over 5 years. This shows moderate but steady dividend growth.
✅ Payout Ratio
The payout ratio is an essential metric for assessing the sustainability of dividend payments. Occidental Petroleum's current EPS-based payout ratio is 70.38%, while the free cash flow-based ratio stands at 39.26%. These figures suggest a balanced approach to dividend distribution, leveraging both profits and cash flows.
| Key Figure | Ratio (%) |
|---|---|
| EPS-based | 70.38 |
| Free cash flow-based | 39.26 |
The EPS-based payout ratio indicates a substantial portion of earnings are dedicated to dividends, which demands careful management to ensure sustainability. The FCF-based ratio reflects a more conservative dividend coverage.
Cashflow & Capital Efficiency
Effective capital management and cash flow generation are pivotal for maintaining and growing dividend outputs. Occidental Petroleum's ability to convert operational performance into free cash flow, as well as its capital deployment efficiency, play crucial roles in its financial resilience.
| Year | Free Cash Flow Yield | Earnings Yield | CAPEX to Operating Cash Flow | Stock-based Compensation to Revenue | Free Cash Flow / Operating Cash Flow Ratio |
|---|---|---|---|---|---|
| 2025 | 10.23 | 5.91 | 61.02 | 0 | 38.98 |
| 2024 | 9.81 | 6.75 | 61.35 | 0.84 | 38.65 |
| 2023 | 11.42 | 8.80 | 50.74 | 0 | 49.26 |
The data demonstrates Occidental's capability to generate consistent cash flows, which is crucial for sustaining dividends and providing a solid base for future growth strategies.
Balance Sheet & Leverage Analysis
Strong balance sheet management and prudent leverage utilization are vital for financial robustness. The following metrics indicate Occidental Petroleum's current leverage and liquidity status, crucial for both dividend security and potential growth financing.
| Year | Debt-to-Equity | Debt-to-Assets | Debt-to-Capital | Net Debt to EBITDA | Current Ratio | Quick Ratio | Financial Leverage |
|---|---|---|---|---|---|---|---|
| 2025 | 0.66 | 0.28 | 0.40 | 1.93 | 0.94 | 0.74 | 2.41 |
| 2024 | 0.79 | 0.32 | 0.44 | 1.96 | 0.95 | 0.73 | 2.50 |
| 2023 | 0.69 | 0.28 | 0.41 | 1.34 | 0.92 | 0.69 | 2.45 |
Occidental's leverage ratios suggest a balanced approach to using debt for operational growth while maintaining solid liquidity positions for unforeseen market conditions.
Fundamental Strength & Profitability
The core performance metrics such as ROE and profit margins are critical for assessing the profitability and overall operational efficiency of Occidental Petroleum. These are integral for both sustaining current dividends and supporting future growth trajectories.
| Year | Return on Equity | Return on Assets | Net Margin | EBIT Margin | EBITDA Margin | Gross Margin | R&D to Revenue |
|---|---|---|---|---|---|---|---|
| 2025 | 6.57 | 2.73 | 10.97 | 17.24 | 52.63 | 33.78 | 0 |
| 2024 | 8.91 | 3.56 | 11.23 | 19.35 | 46.95 | 35.61 | 0 |
| 2023 | 15.45 | 6.31 | 16.49 | 26.03 | 51.31 | 34.39 | 0 |
These profitability metrics highlight Occidental's efficiency in using equity and assets to generate earnings, supporting strong fundamental performance essential for stakeholder confidence.
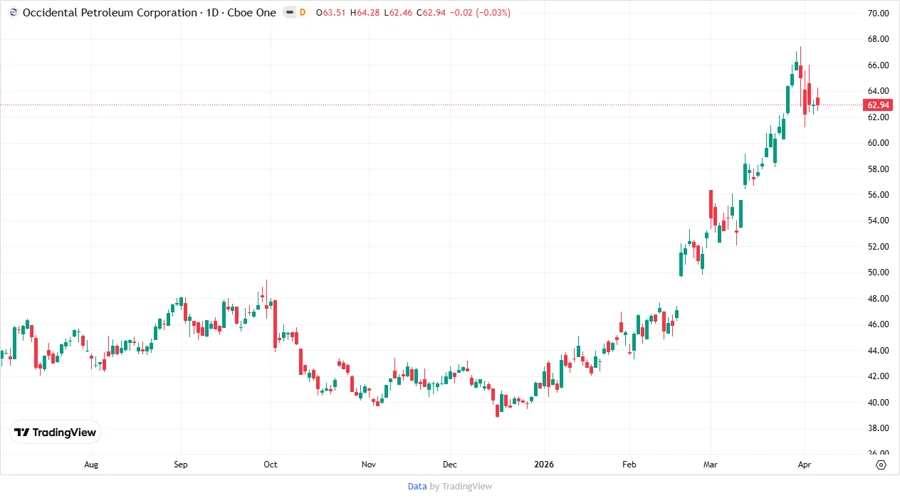
📉 Price Development
🎯 Dividend Scoring System
| Category | Description | Score |
|---|---|---|
| Dividend Yield | Relatively low but stable returns | |
| Dividend Stability | 45-year no-cut history | |
| Dividend Growth | Moderate growth trajectory | |
| Payout Ratio | Balanced approach | |
| Financial Stability | Solid balance sheet | |
| Dividend Continuity | Long-standing payouts | |
| Cashflow Coverage | Strong cashflow support | |
| Balance Sheet Quality | Healthy financial metrics |
Total Score: 45/40
🚀 Rating
Occidental Petroleum Corporation presents a strong investment profile for dividend-focused investors. Its long history of consistent dividend payments, coupled with moderate growth and solid financial fundamentals, offers a reassuring degree of predictability and reliability, making it a worthy consideration for portfolios prioritizing income stability.