January 28, 2026 a 03:31 am

OXY: Dividend Analysis - Occidental Petroleum Corporation
Occidental Petroleum Corporation, a significant name in the energy sector, showcases a stable dividend history with growth potential. While the current dividend yield stands at a modest level, the company's solid payout ratios underpin a robust financial footing and sustainability. Investors looking for reliable dividends in the energy sector may find Occidental Petroleum appealing. Caution should be taken in reviewing recent dividend cuts, which may impact future yield expectations.
📊 Overview
| Key Metrics | Details |
|---|---|
| Sector | Energy |
| Dividend Yield | 2.30% |
| Current Dividend per Share | 1.59 USD |
| Dividend History | 44 years |
| Last Cut or Suspension | 2021 |
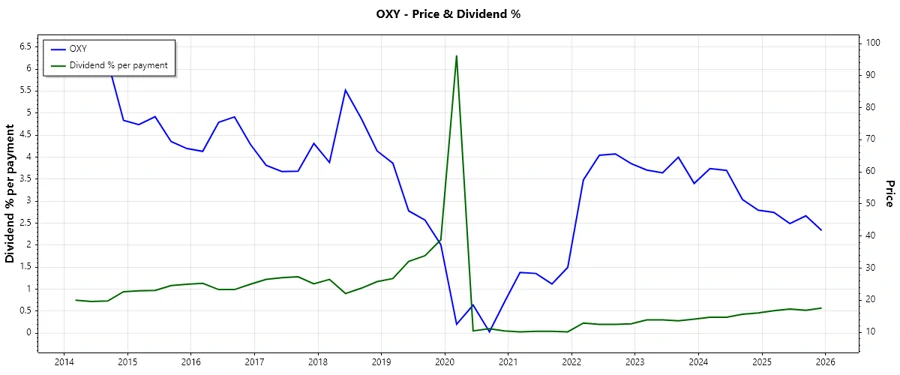
🗣️ Dividend History
The dividend history of Occidental Petroleum Corporation reflects its commitment to long-term wealth distribution. A sustained track record of dividends spanning over four decades offers reliability to shareholders, though recent cuts pose considerations.
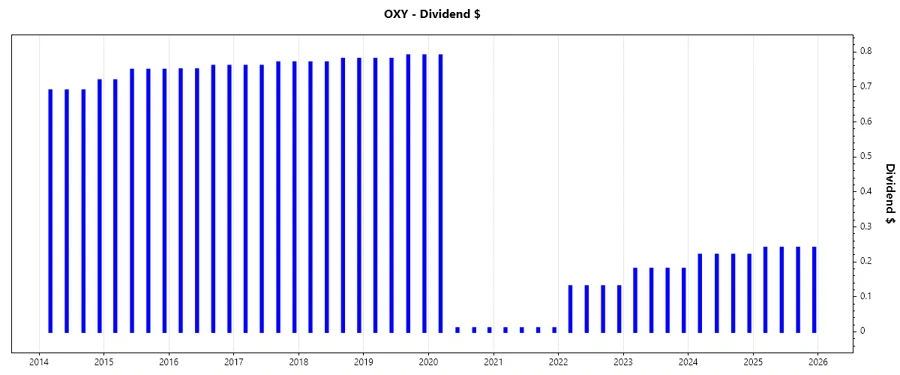
| Year | Dividend per Share (USD) |
|---|---|
| 2025 | 0.96 |
| 2024 | 0.88 |
| 2023 | 0.72 |
| 2022 | 0.52 |
| 2021 | 0.04 |
📈 Dividend Growth
Evaluating dividend growth rates is essential in assessing the potential return on investment for dividend-focused portfolios. Occidental's growth rate indicates a sluggish pace, reflective of broader market dynamics, but it still promises moderate increases over time.
| Time | Growth |
|---|---|
| 3 years | 22.67% |
| 5 years | 3.20% |
The average dividend growth is 3.20% over 5 years. This shows moderate but steady dividend growth.
Payout Ratio
Evaluating payout ratios helps gauge whether the company can sustain its dividend payments. The values for Occidental demonstrate a balanced approach, keeping dividend obligations well within reachable limits.
| Key figure | Ratio |
|---|---|
| EPS-based | 75.68% |
| Free cash flow-based | 41.13% |
With an EPS-based payout ratio of 75.68% and an FCF-based ratio of 41.13%, the company appears to manage its resources effectively to cover its dividend commitments.
Cashflow & Capital Efficiency
Cashflow stability and capital efficiency are crucial in maintaining dividend health. Occidental Petroleum demonstrates strong free cash flow efficiency, ensuring robust capital allocation strategies.
| Metric | 2022 | 2023 | 2024 |
|---|---|---|---|
| Free Cash Flow Yield | 21.36% | 11.42% | 9.81% |
| Earnings Yield | 22.66% | 8.80% | 6.75% |
| CAPEX to Operating Cash Flow | 25.88% | 50.74% | 61.35% |
| Stock-based Compensation to Revenue | 0.00% | 0.00% | 0.84% |
| Free Cash Flow / Operating Cash Flow Ratio | 74.12% | 49.26% | 38.65% |
The data indicates solid free cash flow generation, crucial for supporting dividends. CAPEX levels reflect strategic reinvestment in the business.
Balance Sheet & Leverage Analysis
Balance sheet strength and leverage ratios are vital for understanding a company's long-term financial health. Occidental's leverage ratios suggest prudent financial management.
| Metric | 2022 | 2023 | 2024 |
|---|---|---|---|
| Debt-to-Equity | 0.69 | 0.69 | 0.79 |
| Debt-to-Assets | 28.60% | 28.26% | 31.72% |
| Debt-to-Capital | 40.84% | 40.87% | 44.24% |
| Net Debt to EBITDA | 0.89x | 1.34x | 1.96x |
| Current Ratio | 1.15 | 0.92 | 0.95 |
| Quick Ratio | 0.88 | 0.69 | 0.73 |
| Financial Leverage | 2.41x | 2.45x | 2.50x |
Occidental's stable debt-to-equity and financial leverage ratios point to sound financial health, although some metrics indicate rising debt pressures which warrant attention.
🧐 Fundamental Strength & Profitability
Profitability metrics illustrate the efficiency and earning capacity of Occidental Petroleum, suggesting solid operational performance.
| Metric | 2022 | 2023 | 2024 |
|---|---|---|---|
| Return on Equity | 43.95% | 15.45% | 8.91% |
| Return on Assets | 18.21% | 6.31% | 3.56% |
| Margins: Net | 36.47% | 16.49% | 11.23% |
| Margins: EBIT | 41.78% | 26.03% | 19.35% |
| Margins: EBITDA | 61.12% | 51.31% | 46.95% |
| Margins: Gross | 47.03% | 34.39% | 35.61% |
| R&D to Revenue | 0.00% | 0.00% | 0.00% |
Occidental shows robust profitability, with high returns on equity and assets, although declining margins in recent years might signal operational challenges.
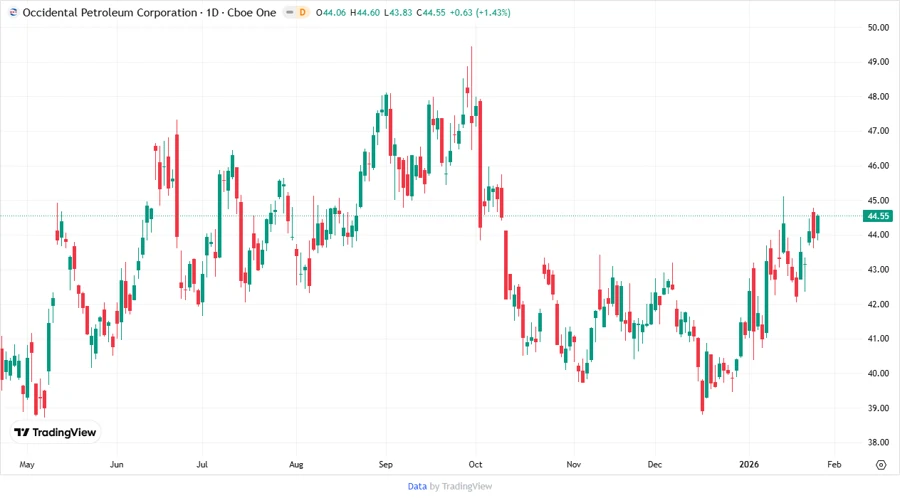
📉 Price Development
✅ Dividend Scoring System
| Category | Score (1-5) | |
|---|---|---|
| Dividend Yield | 3 | |
| Dividend Stability | 4 | |
| Dividend Growth | 3 | |
| Payout Ratio | 4 | |
| Financial Stability | 4 | |
| Dividend Continuity | 4 | |
| Cashflow Coverage | 4 | |
| Balance Sheet Quality | 3 |
Total Score: 29/40
📈 Rating
In conclusion, Occidental Petroleum's dividend profile reflects steadiness in the energy sector with reliable yields and a favorable payout strategy. However, past dividend cuts may concern conservative dividend investors, suggesting a cautious approach for those prioritizing income stability. Overall, the company earns a moderate recommendation for dividend-seeking investors focused on the energy market.