January 21, 2026 a 07:49 am

OXY: Dividend Analysis - Occidental Petroleum Corporation
Occidental Petroleum Corporation (OXY) presents an intriguing dividend profile with a stable historical performance. The company has demonstrated resilience in maintaining its dividends even during challenging market conditions, underscoring its commitment to returning value to shareholders. Despite a suspension adjustment in 2021, its consistent dividend history spanning over four decades reflects financial stewardship and a strong cash flow position. Investors may consider OXY as a viable option for steady income, though monitoring its payout sustainability will be crucial in the evolving energy market landscape.
📊 Overview
Occidental Petroleum Corporation operates within the energy sector, delivering a moderate dividend yield of 2.30%. The current dividend per share stands at 1.59 USD, sustained over an impressive 44-year history. The last cut or suspension was observed in 2021.
| Sector | Dividend Yield | Current Dividend Per Share | Dividend History | Last Cut/Suspension |
|---|---|---|---|---|
| Energy | 2.30 % | 1.59 USD | 44 years | 2021 |
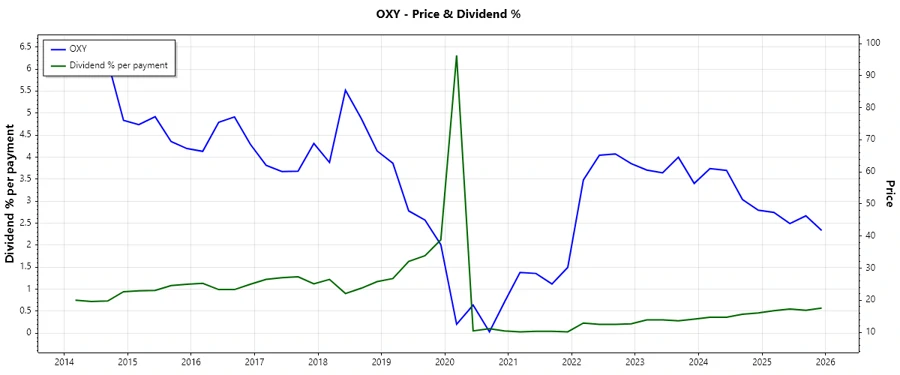
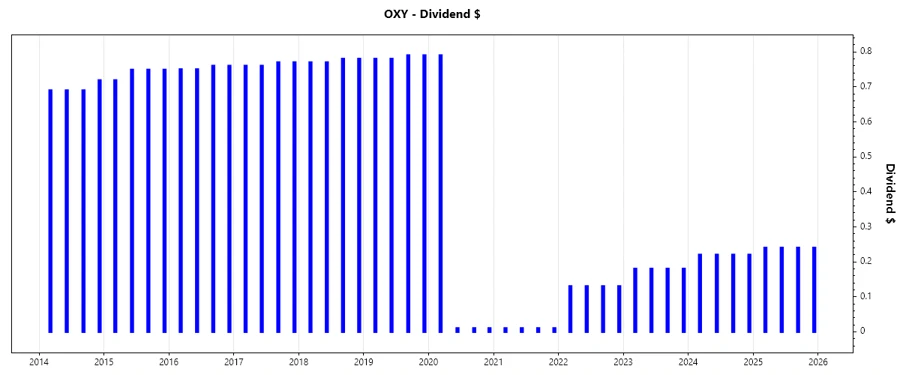
🗣️ Dividend History
The dividend history of OXY reflects its resilience and strategic financial management, showcasing a steady payment pattern even through market volatilities. This historical strength is vital in assessing its capability to sustain future dividends.
| Year | Dividend Per Share (USD) |
|---|---|
| 2025 | 0.96 |
| 2024 | 0.88 |
| 2023 | 0.72 |
| 2022 | 0.52 |
| 2021 | 0.04 |
📈 Dividend Growth
Dividends have grown steadily in recent years, signaling sound financial health and shareholder-friendly policies. Over the past three years, the growth rate averaged 22.67%, while over five years it was a more subdued 3.20%. This trend reflects moderate but evolving fiscal performance.
| Time | Growth |
|---|---|
| 3 years | 22.67 % |
| 5 years | 3.20 % |
The average dividend growth is 3.20% over 5 years, demonstrating moderate yet consistent dividend elevation.
✅ Payout Ratio
The payout ratio provides insights into the company's capacity to sustain its dividend payments. OXY has an EPS-based payout ratio of 75.68% and a free cash flow-based ratio of 41.13%, indicating a balanced dividend policy aligned with its earnings and cash flow capabilities.
| Key Figure | Ratio |
|---|---|
| EPS-based | 75.68 % |
| Free cash flow-based | 41.13 % |
The current ratios suggest sustainability; however, the elevated EPS-based ratio advises close monitoring of earnings stability to ensure continuous dividend payments.
Cashflow & Capital Efficiency
Analyzing cash flow and capital efficiency is critical to understanding OXY's ability to fund dividends and invest for future growth. Key metrics reveal solid free cash flow and a manageable capital expenditure relative to operational cash flow, supporting both ongoing dividends and strategic investments.
| Year | 2022 | 2023 | 2024 |
|---|---|---|---|
| Free Cash Flow Yield | 21.36 % | 11.42 % | 9.81 % |
| Earnings Yield | 22.66 % | 8.80 % | 6.75 % |
| CAPEX to Operating Cash Flow | 25.88 % | 50.74 % | 61.35 % |
| Stock-based Compensation to Revenue | 0 % | 0 % | 0.84 % |
| Free Cash Flow / Operating Cash Flow Ratio | 74.12 % | 49.26 % | 38.65 % |
These figures highlight efficient cash management with a focus on reinvestment and maintaining dividend payouts.
Balance Sheet & Leverage Analysis
Assessing balance sheet strength and leverage ratios is vital for evaluating financial stability and potential risk exposure. OXY's leverage indicators, including a moderate debt-to-equity ratio, suggest a well-managed debt structure that supports long-term growth while minimizing financial risk.
| Year | 2022 | 2023 | 2024 |
|---|---|---|---|
| Debt-to-Equity | 0.69 | 0.69 | 0.79 |
| Debt-to-Assets | 0.29 | 0.28 | 0.32 |
| Debt-to-Capital | 0.41 | 0.41 | 0.44 |
| Net Debt to EBITDA | 0.89 | 1.34 | 1.96 |
| Current Ratio | 1.15 | 0.92 | 0.95 |
| Quick Ratio | 0.88 | 0.69 | 0.73 |
| Financial Leverage | 2.41 | 2.45 | 2.50 |
While these metrics suggest manageable risk, investors should remain vigilant about any changes in leverage that could impact financial flexibility.
Fundamental Strength & Profitability
Profitability ratios and fundamental metrics provide key insights into OXY's operational efficiency and investment attractiveness. Strong margins and profitability ratios underscore a solid business model capable of generating sustainable earnings.
| Year | 2022 | 2023 | 2024 |
|---|---|---|---|
| Return on Equity | 43.95 % | 15.45 % | 8.91 % |
| Return on Assets | 18.21 % | 6.31 % | 3.56 % |
| Net Margin | 36.47 % | 16.49 % | 11.23 % |
| EBIT Margin | 41.78 % | 26.03 % | 19.35 % |
| EBITDA Margin | 61.12 % | 51.31 % | 46.95 % |
| Gross Margin | 47.03 % | 34.39 % | 35.61 % |
| Research & Development to Revenue | 0 % | 0 % | 0 % |
The strong performance across these indicators reflects Occidental's strategic management of resources to maintain robust profitability levels.
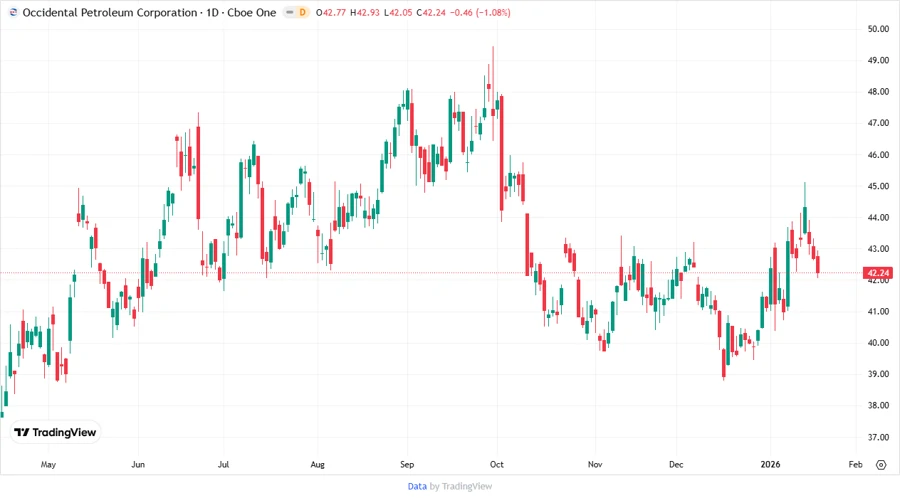
Price Development
Dividend Scoring System
| Criterion | Score | Bar |
|---|---|---|
| Dividend Yield | 3 | |
| Dividend Stability | 4 | |
| Dividend Growth | 3 | |
| Payout Ratio | 3 | |
| Financial Stability | 4 | |
| Dividend Continuity | 4 | |
| Cashflow Coverage | 4 | |
| Balance Sheet Quality | 3 |
Total Score: 28/40
Rating
Occidental Petroleum Corporation exhibits a commendable dividend profile characterized by consistent distribution history and modest growth potential. While the payout ratios remain manageable, they suggest the necessity for continuous efficiency improvements and strategic financial planning. Investors seeking stable income with potential for conservative growth may find OXY a suitable component for a diversified portfolio. However, attentiveness to market conditions and internal financial policy adjustments is advisable for sustained investment success.