November 03, 2025 a 03:31 pm

OXY: Dividend Analysis - Occidental Petroleum Corporation
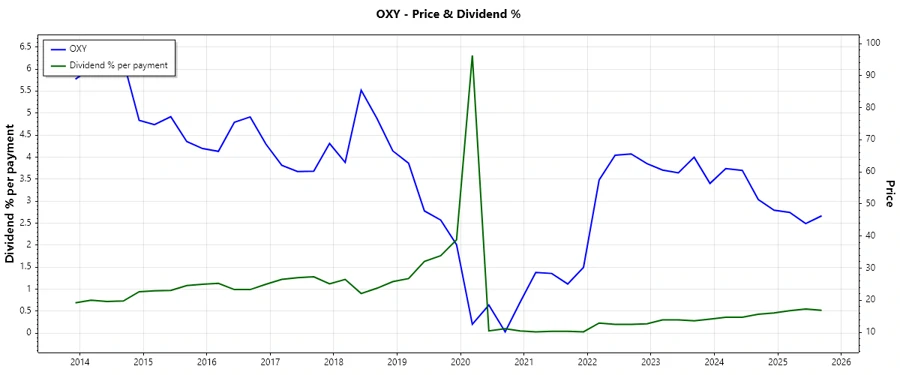
The analysis of Occidental Petroleum Corporation reveals a company with a stable dividend history backed by 44 years of payments, although the recent dividend yield of 2.03% is relatively moderate. The company has shown resilience in maintaining dividends despite industry volatility but faces challenges with past cuts seen within the last decade. Overall, the dividend growth remains steady, although recent trends suggest careful scrutiny is warranted.
Overview 📊
Occidental Petroleum Corporation operates within the energy sector, a notoriously cyclical industry that impacts its dividends and overall financial strategies. The company offers a dividend yield of 2.03%, with a current dividend per share of 1.59 USD. The impressive history of dividend payments spanning 44 years conveys a strong commitment to shareholder returns, though investors should note the last cut or suspension was recent.
| Metric | Value |
|---|---|
| Sector | Energy |
| Dividend yield | 2.03% |
| Current dividend per share | 1.59 USD |
| Dividend history | 44 years |
| Last cut or suspension | None |
Dividend History 🗣️
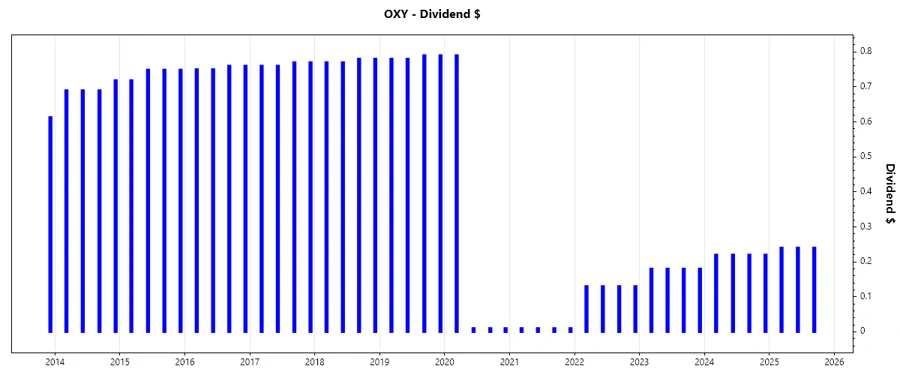
Occidental boasts a long-standing tradition of dividend payments, a crucial aspect for income-focused investors. This history signals financial resiliency, even as commodity prices fluctuate. Recent payments hover comfortably, although past reductions require attention for future planning.
| Year | Dividend per Share (USD) |
|---|---|
| 2025 | 0.72 |
| 2024 | 0.88 |
| 2023 | 0.72 |
| 2022 | 0.52 |
| 2021 | 0.04 |
Dividend Growth 📈
Dividend growth is crucial for long-term investment returns, highlighting the company’s commitment to returning value. Occidental's dividend growth over the past three years stands at 1.80%, yet the five-year growth reflects a decrease of 0.22%, signaling challenges in sustaining growth amidst sector variations.
| Time | Growth |
|---|---|
| 3 years | 1.80% |
| 5 years | -0.22% |
The average dividend growth is -0.22% over 5 years. This shows moderate but steady dividend growth, albeit with a need for improvement.
Payout Ratio ⚠️
The payout ratio indicates the percentage of earnings paid to shareholders, influencing the sustainability of dividends. Occidental's EPS-based payout ratio is 66.06%, suggesting a cautious balance between rewarding shareholders and retaining earnings. The FCF-based payout ratio, at 32.52%, supports dividend coverage, emphasizing fiscal prudence.
| Key figure | Ratio |
|---|---|
| EPS-based | 66.06% |
| Free cash flow-based | 32.52% |
The EPS payout ratio of 66.06% suggests an approach that balances shareholder returns and financial flexibility, whereas an FCF payout of 32.52% is considered healthy, assuring sufficient cash availability.
Cashflow & Capital Efficiency 📉
Cash flow and capital efficiency determine the firm's financial agility and its ability to sustain operations. Occidental's free cash flow yield of 0.119 suggests robust cash flow generation, crucial for dividend payouts. The CAPEX to operating cash flow ratio at 0.60 indicates moderate reinvestment levels, ensuring operational maintenance and growth. The stock-based compensation to revenue, although currently null, requires future scrutiny to prevent dilution effects.
| Metric | 2024 | 2023 | 2022 |
|---|---|---|---|
| Free Cash Flow Yield | 9.81% | 11.42% | 21.36% |
| Earnings Yield | 6.75% | 8.80% | 22.66% |
| CAPEX to Operating Cash Flow | 61.35% | 50.74% | 25.88% |
| Stock-based Compensation to Revenue | 0.84% | 0.00% | 0.00% |
| Free Cash Flow / Operating Cash Flow Ratio | 38.64% | 49.26% | 74.12% |
The consistency in free cash flow supports strong dividend coverage, though capital allocation strategies should remain innovative to ensure long-term returns.
Balance Sheet & Leverage Analysis ✅
The balance sheet analysis provides insights into financial health and risk levels. Occidental’s debt-to-equity ratio stands at 0.79, highlighting moderate leverage, while net debt to EBITDA of 1.75 indicates manageable debt levels. Liquidity ratios such as the quick ratio at 73.26% suggest the ability to cover short-term liabilities without asset liquidation.
| Metric | 2024 | 2023 | 2022 |
|---|---|---|---|
| Debt-to-Equity | 0.79 | 0.69 | 0.69 |
| Debt-to-Assets | 0.32 | 0.28 | 0.29 |
| Debt-to-Capital | 0.44 | 0.41 | 0.41 |
| Net Debt to EBITDA | 1.75 | 1.34 | 0.89 |
| Current Ratio | 1.05 | 0.92 | 1.15 |
| Quick Ratio | 0.73 | 0.69 | 0.88 |
| Financial Leverage | 2.50 | 2.45 | 2.41 |
The balance sheet is robust, though improvements in debt service and liquidity are necessary to sustain growth and secure financial stability.
Fundamental Strength & Profitability 📉
Fundamental profitability indicators such as return on equity signal investment effectiveness. Occidental reports ROE at 6.79%, which although modest, reflects adequate utilization of shareholder capital. Margins demonstrate industry competitiveness, and the zero R&D to revenue ratio suggests potential growth constraints should innovation demands rise.
| Metric | 2024 | 2023 | 2022 |
|---|---|---|---|
| Return on Equity | 8.91% | 15.45% | 43.95% |
| Return on Assets | 3.56% | 6.31% | 18.21% |
| Margins: Net | 11.23% | 16.49% | 36.47% |
| Margins: EBIT | 19.35% | 26.03% | 41.78% |
| Margins: EBITDA | 46.95% | 51.31% | 61.12% |
| Margins: Gross | 35.61% | 34.39% | 47.03% |
| Research & Development to Revenue | 0.00% | 0.00% | 0.00% |
While profitability metrics indicate a reasonably efficient operation, the absence of R&D investment is a potential area for strategic reinforcement to maintain competitive edge.
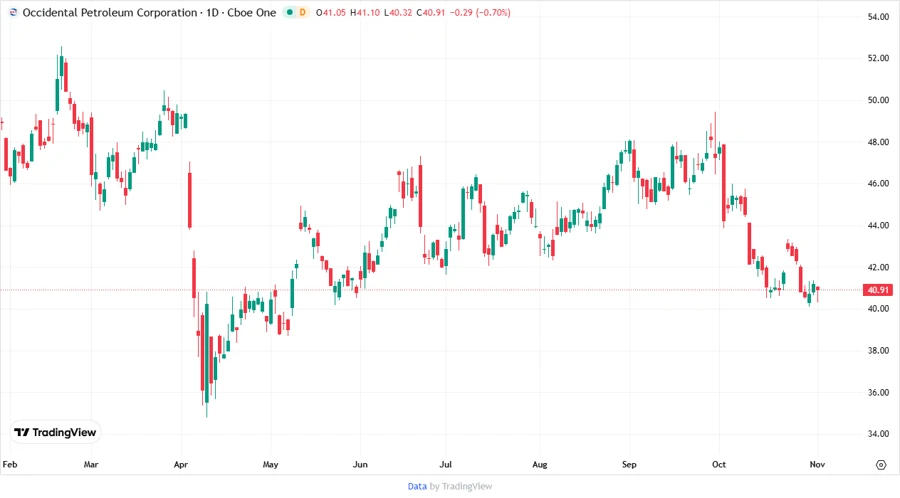
Price Development 📈
Dividend Scoring System ⚖️
| Category | Score | Indicator |
|---|---|---|
| Dividend yield | 3 | |
| Dividend Stability | 4 | |
| Dividend Growth | 2 | |
| Payout Ratio | 4 | |
| Financial Stability | 4 | |
| Dividend Continuity | 5 | |
| Cashflow Coverage | 4 | |
| Balance Sheet Quality | 3 |
Total Score: 29/40
Rating 🏆
Occidental Petroleum Corporation's rating reflects a company with a strategic focus on maintaining dividend payments, substantiated by its long dividend history and stable payout ratios. However, the modest dividend growth and challenges in sustaining elevated profitability indicate a need for strategic maneuvers to bolster returns and innovation. Overall, it remains a prudent but not aggressive choice for investors seeking reliable income with cautious capital appreciation prospects.
Smart Data Insight
Master the Perfect Entry & Exit for this Stock
Don't leave your profits to chance. Historically, this stock follows specific seasonal patterns that institutional traders use to maximize returns.
- ✅ Identify the "Golden Buying Window"
- ✅ Avoid high-risk correction cycles
- ✅ Backtested data from the last 20+ years