January 25, 2026 a 01:15 pm

OTIS: Trend and Support & Resistance Analysis - Otis Worldwide Corporation
Otis Worldwide Corporation has shown a consistent mix of upward and downward price movements. The technical indicators suggest a complex trend that mirrors the unpredictability typical of large manufacturing companies. Investors should consider closely monitoring market conditions and global demands in the elevator and escalator industry.
Trend Analysis
The recent analysis of the Otis Worldwide Corporation stock shows distinct movements over the past few months. With a focus on the exponential moving averages, we compute EMA20 and EMA50 to gain clear insights into the trend. Currently, EMA20 calculates at $89.56 and EMA50 stands at $89.50, indicating a ▲ slight upward trend. This suggests potential positive momentum.
| Date | Close Price | Trend |
|---|---|---|
| 2026-01-23 | $90.98 | ▲ Up |
| 2026-01-22 | $90.27 | ▲ Up |
| 2026-01-21 | $89.48 | ▼ Slight Down |
| 2026-01-20 | $88.14 | ▼ Down |
| 2026-01-16 | $90.16 | ▲ Up |
| 2026-01-15 | $90.35 | ▲ Up |
| 2026-01-14 | $89.95 | ⚖️ Stable |
The trend indicates a general upward momentum backed by the moving averages. Although there are day-to-day fluctuations, the current technical signals suggest positive market sentiment.
Support- and Resistance
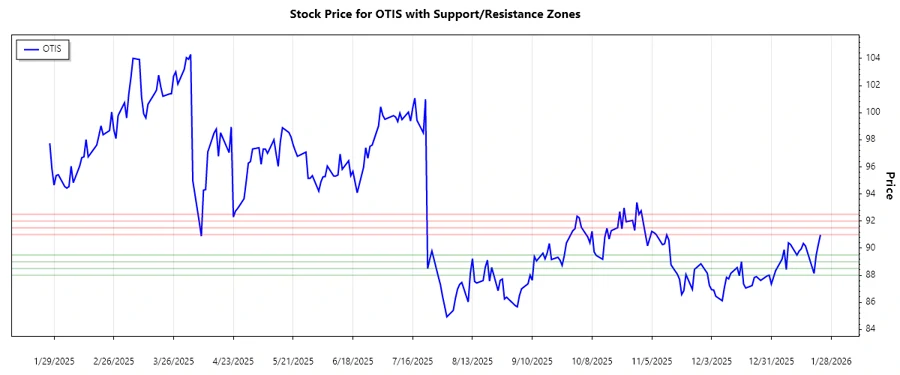
Support and resistance levels reveal important price zones where historical buying and selling occurred. Analyzing the recent price data, we identify two significant support and resistance zones.
| Zone Type | From | To |
|---|---|---|
| Support Zone 1 | $89.00 | $89.50 |
| Support Zone 2 | $88.00 | $88.50 |
| Resistance Zone 1 | $91.00 | $91.50 |
| Resistance Zone 2 | $92.00 | $92.50 |
The current stock price of $90.98 sits between the first support and resistance zone. If the price breaks above the resistance, it might lead to further upward movement signaling investor confidence.
Conclusion
Otis Worldwide Corporation's stock demonstrates a neutral-to-positive tendency based on recent trends and support and resistance analysis. Technical indicators suggest an advantageous position for bullish investors, given the current EMA levels. Potential changes in global demand for elevators and escalators could impact future stock performance, thus requiring close monitoring. The stock remains a compelling watch for investors who can manage potential exposure in this industrial segment.