October 07, 2025 a 01:16 pm
OTIS: Trend and Support & Resistance Analysis - Otis Worldwide Corporation
The recent performance of Otis Worldwide Corporation's stock indicates a nuanced market position. As a leader in manufacturing, installing, and servicing elevators, Otis's technical indicators suggest a mixed trend that needs careful observation. The moving averages point towards a potential stabilization, while support and resistance levels give insights into plausible future price movements.
Trend Analysis
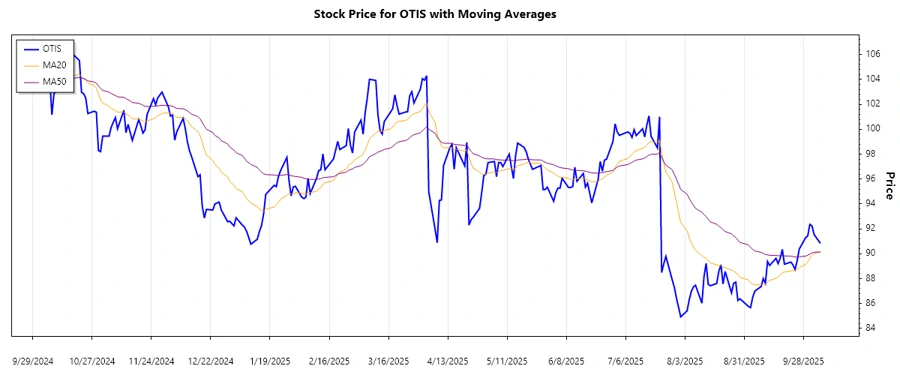
Analyzing the price data of Otis Worldwide Corporation, we observe a mixture of trends over the last few months. By calculating the 20-day EMA and the 50-day EMA, we find that the current trend is a ▼ downward trend with some stability patterns developing, as seen in the EMA values. A consistent drop in price across late September to early October supports this outlook.
| Date | Closing Price | Trend |
|---|---|---|
| 2025-10-06 | 90.83 | ▼ |
| 2025-10-03 | 91.54 | ▼ |
| 2025-10-02 | 92.24 | ▼ |
| 2025-10-01 | 92.36 | ▼ |
| 2025-09-30 | 91.43 | ▼ |
| 2025-09-29 | 91.29 | ▼ |
| 2025-09-26 | 90.38 | ▼ |
The consistent downward trend exhibited by the stock should be monitored for any potential shifts, hinting at consolidation before a potential reversal or continuation.
Support- and Resistance
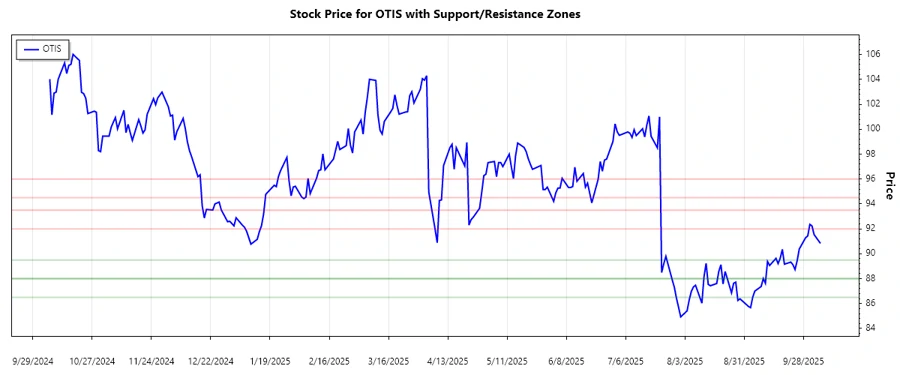
Based on the closing prices, significant support and resistance zones are identified. The current price level is testing these zones frequently, indicating critical junctures for investment decisions.
| Zone Type | From | To |
|---|---|---|
| Support 1 | 88.00 | 89.50 |
| Support 2 | 86.50 | 88.00 |
| Resistance 1 | 92.00 | 93.50 |
| Resistance 2 | 94.50 | 96.00 |
The current stock price is within the first resistance zone, suggesting a potential point for selling pressure or consolidation. The response to this zone will provide a clearer direction.
Conclusion
The technical analysis of Otis Worldwide Corporation presents both opportunities and risks. The downward trend indicates caution, yet the interaction with support and resistance levels could signal potential turning points. Investors should be vigilant of these key zones as they consider portfolio adjustments. For analysts, the data underscores the importance of monitoring real-time price movements and preparing for varying scenarios as the market responds to broader economic signals and company performance metrics.
Smart Data Insight
Master the Perfect Entry & Exit for this Stock
Don't leave your profits to chance. Historically, this stock follows specific seasonal patterns that institutional traders use to maximize returns.
- ✅ Identify the "Golden Buying Window"
- ✅ Avoid high-risk correction cycles
- ✅ Backtested data from the last 20+ years