September 24, 2025 a 02:03 pm**OTIS: Trend and Support & Resistance Analysis - Otis Worldwide Corporation**
Otis Worldwide Corporation (OTIS) has been a historically resilient player in the elevator and escalator industry. Their global footprint and two primary business segments – New Equipment and Service – position them strongly in both emerging and developed markets. Recent market trends and technical analysis suggest indications for strategic investment decisions. It is key to analyze how these trends may impact the future performance of OTIS shares.
Trend Analysis
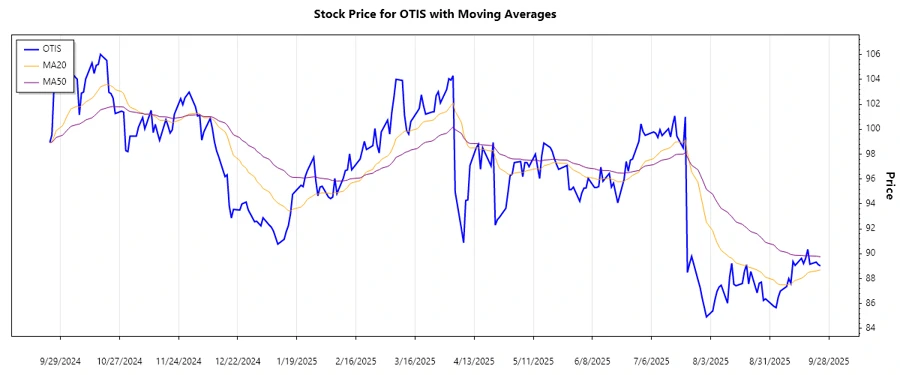
The analysis over the past few months reveals that Otis (OTIS) stock experienced various phases. Recently, the stock shows characteristics of a consolidated phase, with prices fluctuating in a relatively tight range.
| Date | Closing Price | Trend |
|---|---|---|
| 2025-09-24 | $89.03 | ▲ |
| 2025-09-23 | $89.12 | ▲ |
| 2025-09-22 | $89.33 | ▲ |
| 2025-09-19 | $89.16 | ▲ |
| 2025-09-18 | $90.35 | ▲ |
| 2025-09-17 | $89.64 | ▲ |
| 2025-09-16 | $89.21 | ▲ |
Conclusion: The current EMA20 ($89.50) is slightly below EMA50 ($90.80), suggesting a potential weakening in bullish momentum or an emerging sideways movement in the market.
Support and Resistance Analysis
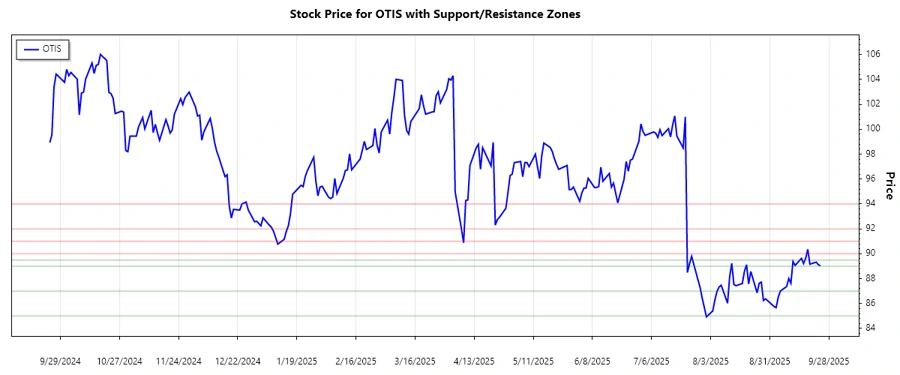
Through technical analysis, we have identified key support and resistance zones. These serve as crucial points where price reactions can be expected.
| Zone Type | From | To |
|---|---|---|
| Support | $85.00 | $87.00 |
| Support | $89.00 | $89.50 |
| Resistance | $90.00 | $91.00 |
| Resistance | $92.00 | $94.00 |
The current price of $89.03 is testing the first support zone. A break below this could indicate a shift towards further downside risks.
Conclusion: Otis stock remains in a critical phase of evaluating these support and resistance levels which, depending on economic conditions and market sentiment, might influence future trends. Although currently in a neutral zone, any significant breakout or breakdown could redefine upcoming stock performance.
Smart Data Insight
Master the Perfect Entry & Exit for this Stock
Don't leave your profits to chance. Historically, this stock follows specific seasonal patterns that institutional traders use to maximize returns.
- ✅ Identify the "Golden Buying Window"
- ✅ Avoid high-risk correction cycles
- ✅ Backtested data from the last 20+ years