November 17, 2025 a 11:44 am
OTIS: Fibonacci Analysis - Otis Worldwide Corporation
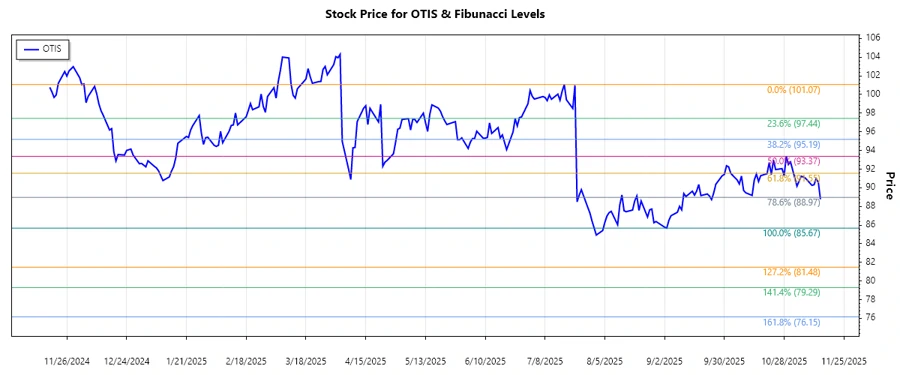
Otis Worldwide Corporation, a dominant player in the vertical transportation industry, has demonstrated resilience amid global uncertainties. As we delve into the recent technical analysis using Fibonacci retracements, it's imperative to understand how these levels could potentially influence buying or selling decisions. Our comprehensive analysis outlines significant levels of potential support or resistance, guiding investors through current market conditions.
Fibonacci Analysis
| Detail | Information |
|---|---|
| Trend Period (Start - End) | July 22, 2025 - November 14, 2025 |
| High Price & Date | $101.07 on July 17, 2025 |
| Low Price & Date | $85.67 on September 3, 2025 |
| Fibonacci Levels |
|
| Current Price Level | Trading at $88.77 |
| Retracement Zone | Below 0.236 (not within retracement range) |
| Technical Interpretation | Currently trading below 0.236 retracement level indicates potential for further downside. Watch for support levels at these Fibonacci retracements. |
Conclusion
Otis Worldwide Corporation is navigating a bearish trend as evident with its positioning below the first Fibonacci retracement level. Investors should be cautious of further potential declines, and consider strategy updates if prices dip beyond support levels. However, the company's foundational strength and global presence offer long-term growth prospects. Analysts will need to monitor Otis's performance closely, focusing on key technical levels for entry and exit points.
Smart Data Insight
Master the Perfect Entry & Exit for this Stock
Don't leave your profits to chance. Historically, this stock follows specific seasonal patterns that institutional traders use to maximize returns.
- ✅ Identify the "Golden Buying Window"
- ✅ Avoid high-risk correction cycles
- ✅ Backtested data from the last 20+ years