May 07, 2026 a 03:31 am

OTIS: Dividend Analysis - Otis Worldwide Corporation
Otis Worldwide Corporation, the leading company in elevator and escalator manufacturing, presents a solid dividend profile attracting income-focused investors. With a moderate yet steady growth rate, Otis offers a reliable income stream underpinned by stable financial fundamentals. However, certain financial metrics suggest areas that require close observation.
📊 Overview
Otis operates in the Industrial Goods sector, providing critical infrastructure products that have a vast demand across urban centers worldwide. The company's dividend yield stands at 2.22%, with a current dividend of $1.64 per share, and boasts a history of 7 consecutive years of dividend payments. The last cut or suspension reported is none, indicating a robust commitment to dividend continuity.
| Detail | Value |
|---|---|
| Sector | Industrial Goods |
| Dividend yield | 2.22% |
| Current dividend per share | $1.64 USD |
| Dividend history | 7 years |
| Last cut or suspension | None |
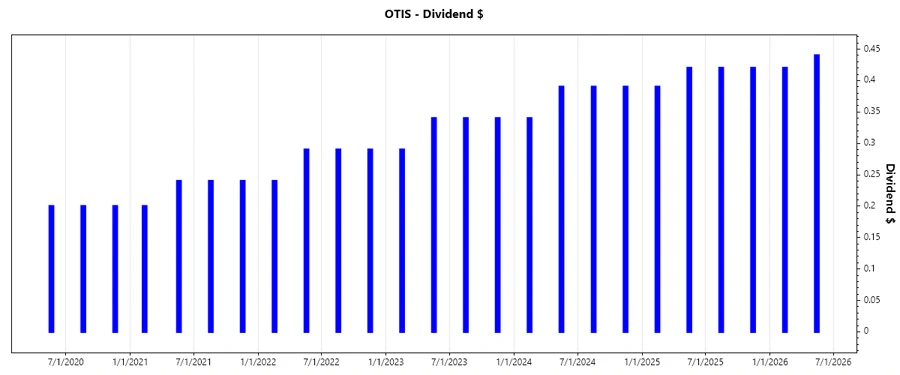
📈 Dividend History
Otis has demonstrated a consistent dividend payout trend, a critical consideration for investors seeking stable income. A reliable dividend history often points to strong cash flow management and organizational resilience.
| Year | Dividend Per Share (USD) |
|---|---|
| 2026 | $0.86 |
| 2025 | $1.65 |
| 2024 | $1.51 |
| 2023 | $1.31 |
| 2022 | $1.11 |
📈 Dividend Growth
Otis's dividend growth over the last few years reflects moderate improvements, crucial for long-term income investors. Understanding dividend growth potential allows stakeholders to anticipate future income streams.
| Time | Growth |
|---|---|
| 3 years | 14.13% |
| 5 years | 22.42% |
The average dividend growth is 22.42% over 5 years. This shows moderate but steady dividend growth.
⚠️ Payout Ratio
The payout ratio provides insight into dividend sustainability. A high ratio could imply a risk of a cut during downturns, whereas a lower ratio suggests increased safety and room for growth.
| Key figure | Ratio |
|---|---|
| EPS-based | 43.07% |
| Free cash flow-based | 37.81% |
The EPS-based payout ratio stands at 43.07%, and FCF-based at 37.81%, indicating that Otis has room to maintain or slightly increase its dividend without overleveraging its payouts.
📊 Cashflow & Capital Efficiency
Cash flow strength and capital efficiency are pivotal for sustaining dividends and funding growth initiatives. Efficient cash flow usage ensures continued dividends without compromising financial health.
| 2023 | 2024 | 2025 | |
|---|---|---|---|
| Free Cash Flow Yield | 5.67% | 3.86% | 4.20% |
| Earnings Yield | 4.97% | 4.42% | 4.02% |
| CAPEX to Operating Cash Flow | 8.30% | 8.06% | 9.52% |
| Stock-based Compensation to Revenue | 0.25% | 0.00% | 0.55% |
| Free Cash Flow / Operating Cash Flow Ratio | 90.48% | 91.94% | 90.48% |
This indicates a stable cash flow scenario with efficient utilization of CAPEX, suggesting readiness to sustain dividend payouts and potential growth projects.
📉 Balance Sheet & Leverage Analysis
A thorough examination of leverage ratios and balance sheet strength is essential to evaluate financial stability and borrowing flexibility. Too much debt may hamper dividend payouts in challenging economic conditions.
| 2023 | 2024 | 2025 | |
|---|---|---|---|
| Debt-to-Equity | -1.48 | -1.80 | -1.62 |
| Debt-to-Assets | 72.22% | 77.25% | 82.14% |
| Debt-to-Capital | 306.63% | 224.50% | 260.57% |
| Net Debt to EBITDA | 2.47 | 2.89 | 3.32 |
| Current Ratio | 0.84 | Slightly below 1 | Below 1 |
| Quick Ratio | 0.77 | 0.92 | 0.77 |
Despite a high debt-to-capital ratio, Otis maintains sufficient interest coverage, indicating the ability to meet short-term obligations and sustain operations.
📈 Fundamental Strength & Profitability
Understanding profitability metrics such as Return on Equity (ROE), Return on Assets (ROA), and margins provides insight into operational efficiency and potential performance improvement areas for sustaining dividends.
| 2023 | 2024 | 2025 | |
|---|---|---|---|
| Return on Equity | -28.55% | -33.93% | -25.67% |
| Return on Assets | 13.90% | 14.54% | 12.99% |
| Margins: Net | 9.90% | 11.53% | 9.59% |
| Margins: Gross | 29.51% | 29.85% | 30.28% |
| R&D to Revenue | 1.01% | 1.06% | 1.05% |
The company exhibits robust asset returns although equity returns appear negative, indicating potential concerns in profitability over investments or shareholder equity.
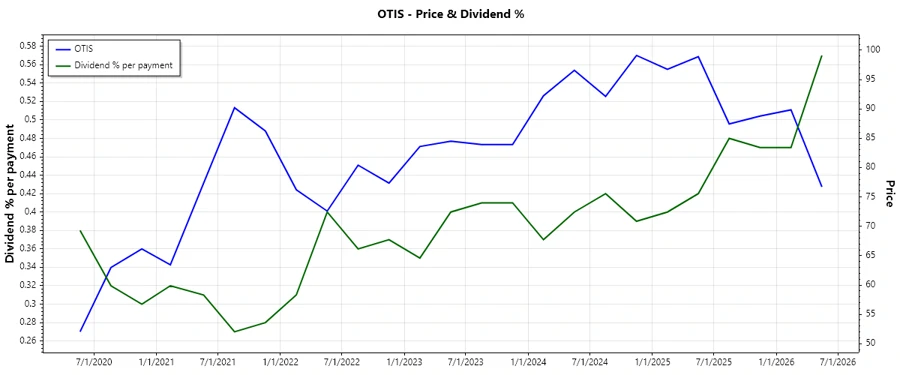
📈 Price Development
📈 Dividend Scoring System
| Category | Score | |
|---|---|---|
| Dividend yield | 3 | |
| Dividend Stability | 4 | |
| Dividend growth | 3 | |
| Payout ratio | 4 | |
| Financial stability | 3 | |
| Dividend continuity | 4 | |
| Cashflow Coverage | 3 | |
| Balance Sheet Quality | 3 |
Total Score: 27/40
✅ Rating
Otis Worldwide Corporation offers a promising dividend profile with a consistent payout history and moderate growth outlook. Although certain leverage metrics require attention, its strong cashflow and earnings coverage support ongoing dividend commitments. Investors seeking moderate income stability may find Otis a suitable fit, whereas risk-averse stakeholders might consider further monitoring financial leverage aspects.
Smart Data Insight
Master the Perfect Entry & Exit for this Stock
Don't leave your profits to chance. Historically, this stock follows specific seasonal patterns that institutional traders use to maximize returns.
- ✅ Identify the "Golden Buying Window"
- ✅ Avoid high-risk correction cycles
- ✅ Backtested data from the last 20+ years