April 21, 2026 a 11:31 am

📊 OTIS: Dividend Analysis - Otis Worldwide Corporation
Otis Worldwide Corporation (OTIS) showcases a strong position in the market with a healthy dividend profile. The company has demonstrated consistent dividend payments and has shown a moderate but steady growth in its dividend payouts over the years. Despite challenges in the broader market, OTIS has managed to sustain its dividend yield, providing long-term investors with a reliable income stream. However, potential investors should evaluate the financial stability indicators to assess the company's ability to maintain its dividend policies.
🗣️ Overview
Otis Worldwide Corporation operates within a competitive sector. Currently, it presents a dividend yield of 0.94%, which is modest yet highlights its reliability in dividend distribution. Investors have benefited from a current dividend per share of 1.64 USD. With a 7-year dividend history and no recent dividend cuts or suspensions, OTIS demonstrates a commitment to maintaining shareholder value.
| Parameter | Value |
|---|---|
| Sector | Industrial |
| Dividend yield | 0.94% |
| Current dividend per share | 1.64 USD |
| Dividend history | 7 years |
| Last cut or suspension | None |
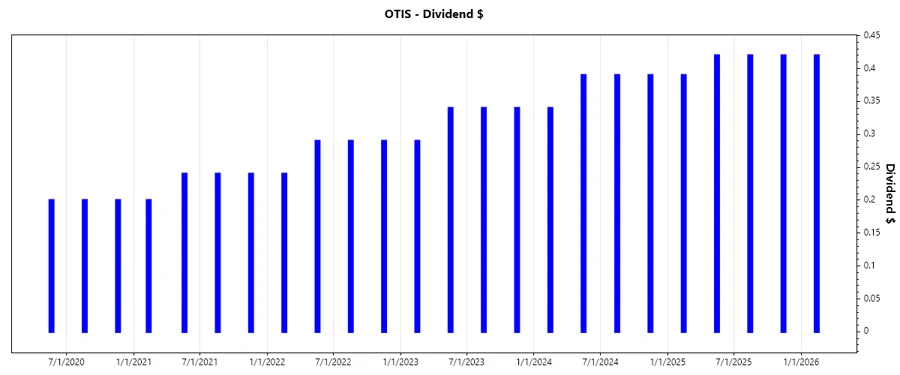
📈 Dividend History
The dividend history of a company reveals its past commitment to rewarding shareholders. OTIS has shown consistency in its dividend payments, which is indicative of a stable business model. This stability appeals to income-focused investors seeking reliable dividend payouts.
| Year | Dividend per Share (USD) |
|---|---|
| 2026 | 0.42 |
| 2025 | 1.65 |
| 2024 | 1.51 |
| 2023 | 1.31 |
| 2022 | 1.11 |
📉 Dividend Growth
Dividend growth is a crucial parameter for investors looking to capture future income growth. OTIS has showcased a 3-year dividend growth of 14.13% and a 5-year growth of 22.42%. Consistent growth in dividends highlights the company's confidence in its earning projections and operational stability.
| Time | Growth |
|---|---|
| 3 years | 14.13% |
| 5 years | 22.42% |
The average dividend growth is 22.42% over 5 years. This shows moderate but steady dividend growth.
✅ Payout Ratio
A company's payout ratio gives insight into how much of its earnings are distributed as dividends. The EPS-based payout ratio at 46.75% and a cash flow-based ratio at 44.35% suggest that Otis Worldwide Corporation allocates a manageable portion of its earnings to dividends, ensuring sustainability of these payouts for the future while still reserving earnings for reinvestment.
| Key Figure | Ratio |
|---|---|
| EPS-based | 46.75% |
| Free cash flow-based | 44.35% |
With moderate payout ratios, Otis's dividend practices appear well-covered by both earnings and free cash flow metrics, supporting future continuity.
📊 Cashflow & Capital Efficiency
Effective cash flow management and capital allocation are vital for maintaining operational flexibility and enhancing shareholder returns. The stability and adequacy of cash flows drive dividend policies, reinvestment opportunities, and debt servicing ability.
| Year | 2023 | 2024 | 2025 |
|---|---|---|---|
| Free Cash Flow Yield | 4.05% | 3.86% | 4.20% |
| Earnings Yield | 3.82% | 4.42% | 4.02% |
| CAPEX to Operating Cash Flow | 8.48% | 8.06% | 9.52% |
| Stock-based Compensation to Revenue | 0% | 0% | 0.55% |
| Free Cash Flow / Operating Cash Flow Ratio | 91.52% | 91.94% | 90.48% |
The strong cash flow conversions and manageable CAPEX reflect high cash generation efficiency, reinforcing Otis’s capability to uphold its dividend commitments.
⚠️ Balance Sheet & Leverage Analysis
The balance sheet health of Otis Worldwide Corporation demonstrates its solvency and financial stability, which are crucial for sustaining long-term growth and fulfilling dividend obligations.
| Year | 2023 | 2024 | 2025 |
|---|---|---|---|
| Debt-to-Equity | -1.48 | -1.80 | -1.62 |
| Debt-to-Assets | 72.22% | 77.25% | 82.14% |
| Debt-to-Capital | 3.07 | 2.24 | 2.61 |
| Net Debt to EBITDA | 2.47 | 2.89 | 3.32 |
| Current Ratio | 0.99 | 0.99 | 0.85 |
| Quick Ratio | 0.89 | 0.92 | 0.77 |
The leverage metrics suggest that OTIS is highly leveraged, which necessitates cautious monitoring. Nonetheless, its ability to meet its short-term liabilities is reflected in the ratios above.
📣 Fundamental Strength & Profitability
Analyzing key profitability metrics allows us to assess the operational efficiency and competitive advantage of OTIS. Strong profitability metrics are indicative of superior operational performance and robust market positioning.
| Year | 2023 | 2024 | 2025 |
|---|---|---|---|
| Return on Equity | -28.55% | -33.93% | -25.67% |
| Return on Assets | 13.90% | 14.54% | 12.99% |
| Net Margin | 9.90% | 11.53% | 9.59% |
| EBIT Margin | 15.81% | 14.38% | 14.78% |
| EBITDA Margin | 17.17% | 15.65% | 15.99% |
| Gross Margin | 29.51% | 29.85% | 30.28% |
| R&D to Revenue | 1.01% | 1.06% | 1.05% |
While experiencing negative ROE, OTIS shows strong asset efficiency and stable margin profiles, indicating a competitive business structure.
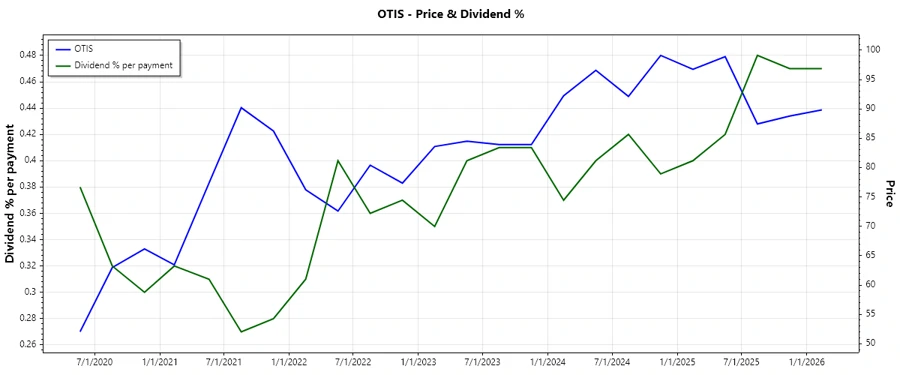
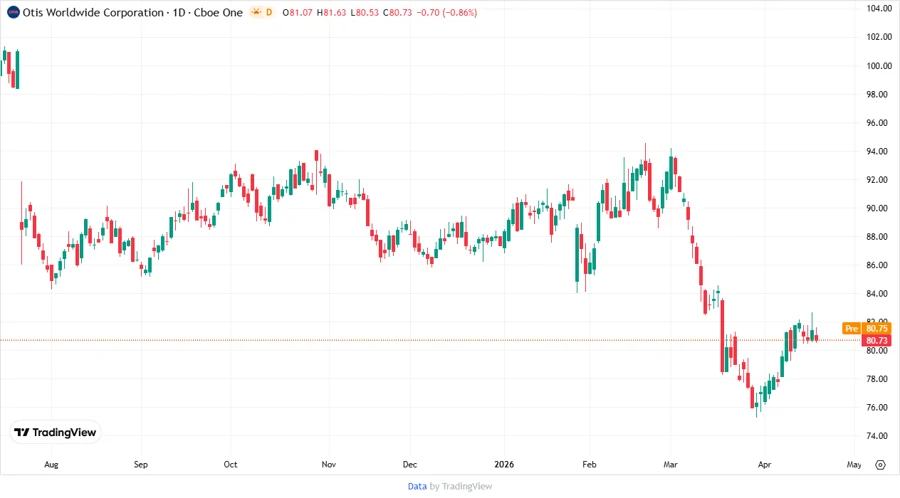
📊 Price Development
📋 Dividend Scoring System
| Criteria | Comments | Score |
|---|---|---|
| Dividend yield | Below industry average (0.94%) | |
| Dividend Stability | 7-year history without cuts | |
| Dividend growth | Moderate growth over 5 years | |
| Payout ratio | EPS and FCF based ratios are healthy | |
| Financial stability | High leverage, needs monitoring | |
| Dividend continuity | Consistent payouts | |
| Cashflow Coverage | Strong cash conversion | |
| Balance Sheet Quality | Currently mixed signals |
Total Score: 32/40
🏆 Rating
In summary, Otis Worldwide Corporation is positioned as a resilient entity within its sector, offering a stable dividend profile with modest growth prospects. While currently offering a lower yield, the company's success in consistently rewarding shareholders and maintaining high liquidity ratios advocates confidence. As such, we rate OTIS as a cautious buy, particularly appealing to income-focused investors with a long-term investment horizon.
Smart Data Insight
Master the Perfect Entry & Exit for this Stock
Don't leave your profits to chance. Historically, this stock follows specific seasonal patterns that institutional traders use to maximize returns.
- ✅ Identify the "Golden Buying Window"
- ✅ Avoid high-risk correction cycles
- ✅ Backtested data from the last 20+ years