March 04, 2026 a 07:31 am


OTIS: Dividend Analysis - Otis Worldwide Corporation
Otis Worldwide Corporation showcases a robust dividend profile characterized by a steady yield and consistent growth over recent years. With a strategic alignment towards maintaining dividend payouts, Otis ensures stability and growth, reinforcing investor confidence. The juxtaposition of growth and payout metrics suggest Otis's capability to balance shareholder rewards with reinvestment strategies.
📊 Overview
Otis operates within a sector of crucial importance, exhibiting a dynamic yet stable dividend yield, indicating sound fiscal health.
| Data | Figures |
|---|---|
| Sector | Industrial |
| Dividend yield | 1.87 % |
| Current dividend per share | 1.64 USD |
| Dividend history | 7 years |
| Last cut or suspension | None |
📈 Dividend History
The consistency in Otis's dividend history reflects a commitment to rewarding shareholders. Understanding historical dividend payouts helps forecast stability and predictability in future distributions.
| Year | Dividend per Share |
|---|---|
| 2026 | 0.42 USD |
| 2025 | 1.65 USD |
| 2024 | 1.51 USD |
| 2023 | 1.31 USD |
| 2022 | 1.11 USD |
📈 Dividend Growth
The sustained growth in dividends showcases Otis’s strategic approach towards incrementally enhancing shareholder value.
| Time | Growth |
|---|---|
| 3 years | 14.13 % |
| 5 years | 22.42 % |
The average dividend growth is 22.42 % over 5 years. This shows moderate but steady dividend growth.
⚠️ Payout Ratio
Payout ratios provide insights into Otis's dividend sustainability and its financial prudence in managing resources.
| Key figure | Ratio |
|---|---|
| EPS-based | 46.75 % |
| Free cash flow-based | 44.35 % |
A payout ratio of 46.75 % (EPS) and 44.35 % (FCF) indicates an excellent balance between rewarding shareholders and retaining capital for growth.
✅ Cashflow & Capital Efficiency
Examining cash flow and capital efficiency highlights Otis's aptitude in converting its financial activities into growth and shareholder value.
| Year | 2023 | 2024 | 2025 |
|---|---|---|---|
| Free Cash Flow Yield | 4.05 % | 3.86 % | 4.20 % |
| Earnings Yield | 3.82 % | 4.42 % | 4.02 % |
| CAPEX to Operating Cash Flow | 9.52 % | 8.06 % | 9.52 % |
| Stock-based Compensation to Revenue | 0.12 % | 0.00 % | 0.55 % |
| Free Cash Flow / Operating Cash Flow Ratio | 90.48 % | 91.94 % | 90.48 % |
Consistent cash flow indicators illustrate solid financial management, positioning Otis for stable future dividends and potential capital growth.
🔑 Balance Sheet & Leverage Analysis
The balance sheet metrics outline the leverage and liquidity structure, essential for understanding Otis's operational flexibility and risk exposure.
| Year | 2023 | 2024 | 2025 |
|---|---|---|---|
| Debt-to-Equity | -148.40 % | -180.32 % | -162.28 % |
| Debt-to-Assets | 72.22 % | 77.25 % | 82.14 % |
| Debt-to-Capital | 306.63 % | 224.50 % | 260.57 % |
| Net Debt to EBITDA | 2.47 | 2.89 | 3.32 |
| Current Ratio | 0.99 | 0.99 | 0.85 |
| Quick Ratio | 0.89 | 0.92 | 0.77 |
| Financial Leverage | -205.46 % | -233.42 % | -197.57 % |
The financial structure reveals reliance on leverage; however, the earnings coverage illustrates Otis's capability to meet obligations comfortably.
📈 Fundamental Strength & Profitability
Assessing fundamental strengths through profitability ratios provides critical insights into operational efficiency and value generation.
| Year | 2023 | 2024 | 2025 |
|---|---|---|---|
| Return on Equity | -28.55 % | -33.93 % | -25.67 % |
| Return on Assets | 13.90 % | 14.54 % | 12.99 % |
| Margins: Net | 9.90 % | 11.53 % | 9.59 % |
| EBIT Margin | 15.81 % | 14.38 % | 14.78 % |
| EBITDA Margin | 17.17 % | 15.65 % | 15.99 % |
| Gross Margin | 29.51 % | 29.85 % | 30.28 % |
| R&D to Revenue | 1.01 % | 1.07 % | 1.05 % |
These profitability indicators reinforce the firm's efficiency in leveraging its assets towards achieving shareholder returns despite negative equity returns.
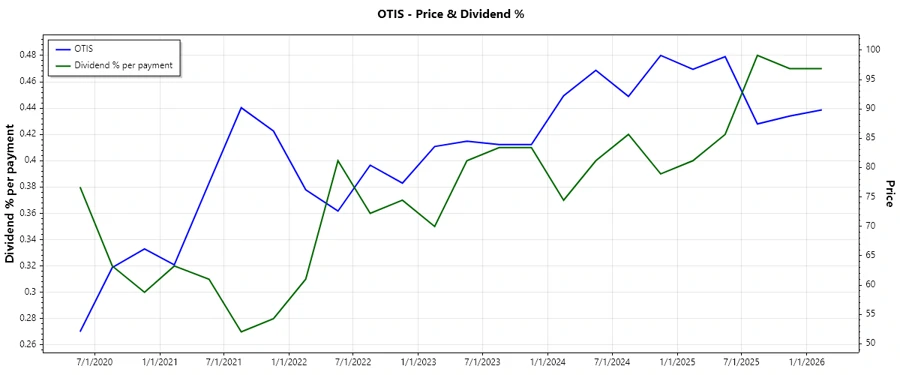
📉 Price Development
🏆 Dividend Scoring System
| Category | Score | Score Bar |
|---|---|---|
| Dividend yield | 3 | |
| Dividend Stability | 4 | |
| Dividend growth | 4 | |
| Payout ratio | 5 | |
| Financial stability | 2 | |
| Dividend continuity | 5 | |
| Cashflow Coverage | 3 | |
| Balance Sheet Quality | 2 |
Total Score: 28 out of 40
🗣️ Rating
Otis Worldwide Corporation presents as a solid investment option in the dividend segment. With a balanced approach to growth and payout ratios, coupled with historical consistency, it stands competitive. Potential investors might consider its leverage metrics and overall financial health, but the dividend strength provides an attractive proposition.