October 09, 2025 a 02:03 pm

ORLY: Trend and Support & Resistance Analysis - O'Reilly Automotive, Inc.
O'Reilly Automotive, Inc. exhibits a significant upward momentum in recent months, driven by robust business performance in the automotive aftermarket sector. As a key player in the industry, ORLY's extensive product range continues to attract both DIY and professional service providers. Recent price actions suggest a steady growth trajectory, making the stock a potential candidate for long-term portfolios.
Trend Analysis
The following table details the trend analysis based on EMA calculations:
| Date | Closing Price | Trend |
|---|---|---|
| 2025-10-09 | 100.88 | ▲ Uptrend |
| 2025-10-08 | 100.76 | ▲ Uptrend |
| 2025-10-07 | 101.85 | ▲ Uptrend |
| 2025-10-06 | 103.30 | ▲ Uptrend |
| 2025-10-03 | 104.79 | ▲ Uptrend |
| 2025-10-02 | 104.97 | ▲ Uptrend |
| 2025-10-01 | 105.68 | ▲ Uptrend |
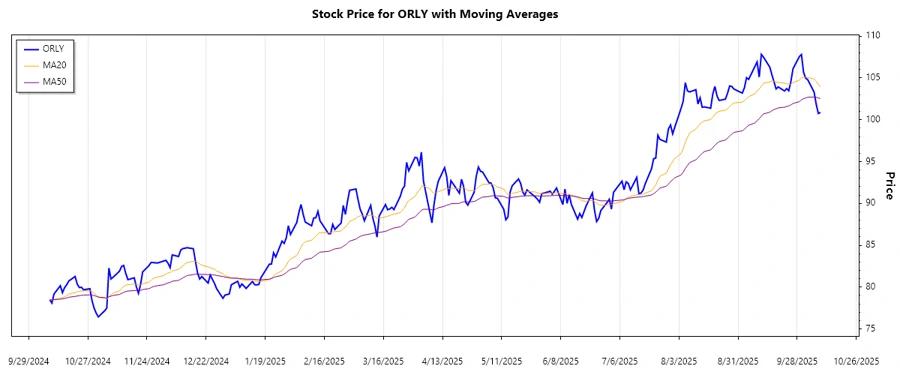
The consistent positions of EMA20 above EMA50 indicate a strong upward trend over the recent trading period. This is further corroborated by rising stock prices, suggesting bullish market sentiment.
Support- and Resistance
The following table outlines identified support and resistance zones:
| Zone Type | From | To |
|---|---|---|
| Support 1 | 98.00 | 100.00 |
| Support 2 | 95.00 | 97.00 |
| Resistance 1 | 106.00 | 108.00 |
| Resistance 2 | 109.00 | 111.00 |
Currently, the closing price of ORLY is positioned between the upper support zone of 98.00 - 100.00 and the lower resistance zone of 106.00 - 108.00. This positioning suggests a consolidation phase, potentially building pressure for future breakout movements.
Conclusion
O'Reilly Automotive, Inc. (ORLY) has shown robust upward momentum, with consistent support from technical indicators like EMA crossovers configuring a bullish outlook. While the stock currently consolidates within defined support and resistance zones, its trend suggests potential for further growth. Investors should be mindful of volatility and monitor for breakout opportunities, balancing potential gains against inherent market risks.
Smart Data Insight
Master the Perfect Entry & Exit for this Stock
Don't leave your profits to chance. Historically, this stock follows specific seasonal patterns that institutional traders use to maximize returns.
- ✅ Identify the "Golden Buying Window"
- ✅ Avoid high-risk correction cycles
- ✅ Backtested data from the last 20+ years