May 05, 2026 a 08:00 am

ORLY: Fundamental Ratio Analysis - O'Reilly Automotive, Inc.
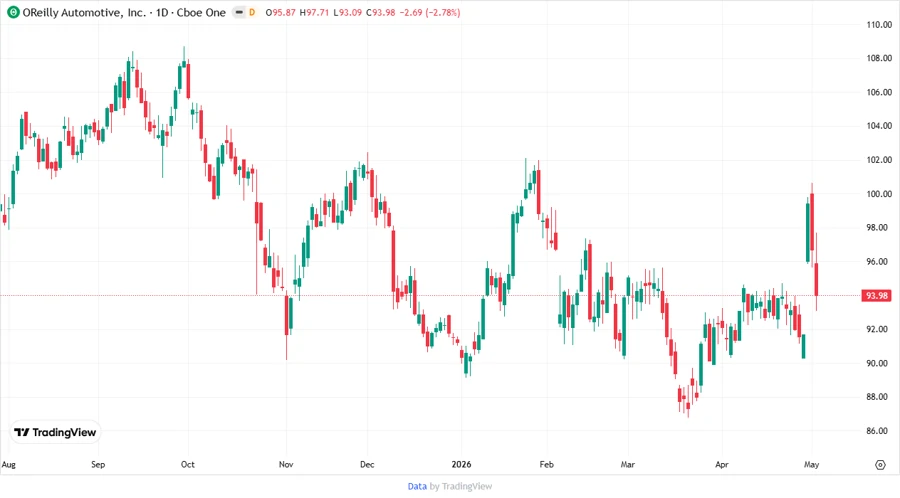
O'Reilly Automotive, Inc. (ORLY) operates a robust network of retail stores across the United States, supplying a wide variety of automotive parts and accessories. Despite facing challenges in a competitive market, its strong historical performance and strategic growth plans position it as a formidable player in the auto-parts industry.
Fundamental Rating
The company's overall fundamentals reflect a mixed performance with room for improvement in various financial metrics.
| Category | Score | Score Bar |
|---|---|---|
| Discounted Cash Flow | 3 | |
| Return on Equity | 1 | |
| Return on Assets | 5 | |
| Debt to Equity | 1 | |
| Price to Earnings | 2 | |
| Price to Book | 1 |
Historical Rating
The historical ratings offer insights into the company's performance stability over time.
| Date | Overall | DCF | ROE | ROA | Debt/Equity | P/E | P/B |
|---|---|---|---|---|---|---|---|
| 2026-05-04 | 2 | 3 | 1 | 5 | 1 | 2 | 1 |
| Previous | 0 | 3 | 1 | 5 | 1 | 2 | 1 |
Analyst Price Targets
Analysts have offered a range of price targets, reflecting varied expectations for the stock's future value.
| High | Low | Median | Consensus |
|---|---|---|---|
| 115 | 105 | 110 | 110.64 |
Analyst Sentiment
The sentiment from analysts mostly leans towards a 'Buy' rating, with minimal sell recommendations.
| Rating | Count | Distribution |
|---|---|---|
| Strong Buy | 0 | |
| Buy | 28 | |
| Hold | 18 | |
| Sell | 1 | |
| Strong Sell | 0 |
Conclusion
O'Reilly Automotive, Inc. demonstrates a solid foundation as it continues to navigate a competitive market landscape with a reasonable analyst consensus leaning towards 'Buy'. While its fundamentals present both strengths and opportunities for improvement, the company remains attractive for investors looking for growth potential within the auto-parts industry. Careful observation of its financial metrics' evolution and strategic initiatives could yield profitable insights. Potential investors should weigh the mixed historical performance against the prospect of future gains.
Smart Data Insight
Master the Perfect Entry & Exit for this Stock
Don't leave your profits to chance. Historically, this stock follows specific seasonal patterns that institutional traders use to maximize returns.
- ✅ Identify the "Golden Buying Window"
- ✅ Avoid high-risk correction cycles
- ✅ Backtested data from the last 20+ years