April 08, 2026 a 05:15 am
ORLY: Fibonacci Analysis - O'Reilly Automotive, Inc.
O'Reilly Automotive, Inc. (ORLY) has shown resilience in the automotive aftermarket industry. With a network of over 5,700 stores across the U.S. and Mexico, the company offers a wide range of products for both do-it-yourself and professional services. Recent stock trends indicate a substantial movement, making it a candidate for a detailed technical analysis.
Fibonacci Analysis
| Detail | Information |
|---|---|
| Trend Start Date | 2025-10-01 |
| Trend End Date | 2026-04-07 |
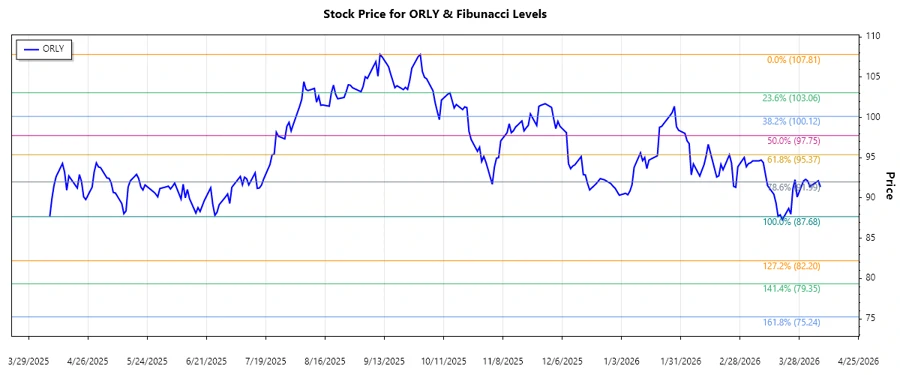
| High Point | $107.81 on 2025-09-30 |
| Low Point | $87.68 on 2025-04-08 |
| Fibonacci Level | Price Level |
|---|---|
| 0.236 | $92.37 |
| 0.382 | $89.92 |
| 0.5 | $87.74 |
| 0.618 | $86.12 |
| 0.786 | $83.85 |
The current price of $91.36 is within the 0.236 retracement zone. This level may act as a temporary resistance.
Conclusion
The analysis of O'Reilly Automotive's stock price shows a correction from its peak at $107.81 down to recent levels. The retracement to the 0.236 level suggests a possible stabilization zone before the next movement. Investors should be cautious of further corrections but may also consider opportunities if the stock finds support near current levels. The stock's ability to maintain above the 0.236 level will be critical for future upward momentum. Analysts should monitor the price action around these Fibonacci levels to assess potential support or resistance points, which could indicate further directional trends.