October 04, 2025 a 06:45 am
ORCL: Fibonacci Analysis - Oracle Corporation
Oracle Corporation has shown substantial growth in recent months, proving its resilience in the competitive cloud software and enterprise solutions space. As a major player in the IT environment, Oracle's diverse product offerings continue to drive strong financial performance. With the latest market conditions reflecting positive investor sentiment, extensive technical analysis suggests that Oracle could seize further growth opportunities in the upcoming quarters.
Fibonacci Analysis
| Analysis Parameter | Details |
|---|---|
| Trend Period | 2024-11-05 to 2025-09-10 |
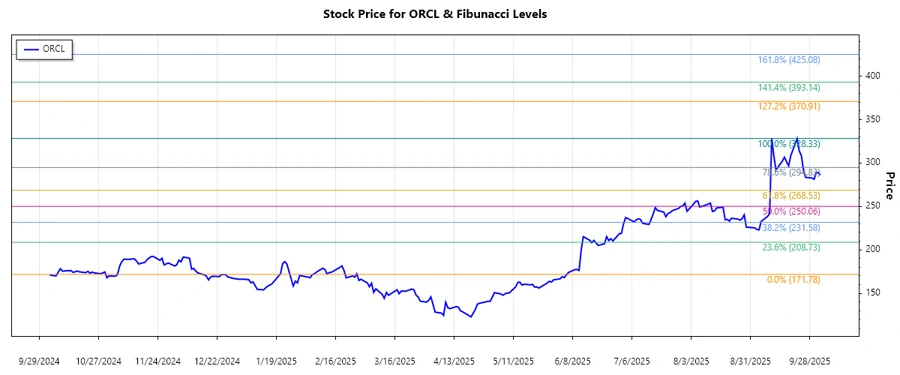
| High Point | 328.33 on 2025-09-10 |
| Low Point | 171.78 on 2024-11-05 |
| Fibonacci 0.236 Level | 224.64 |
| Fibonacci 0.382 Level | 246.31 |
| Fibonacci 0.5 Level | 250.06 |
| Fibonacci 0.618 Level | 271.72 |
| Fibonacci 0.786 Level | 301.60 |
| Current Price Retracement | Current trading around 286.14, within the 0.618 retracement level. |
| Technical Interpretation | The current price within the 0.618 retracement level suggests potential support, indicating possible continuation of the bullish trend. |
Image: Detailed stock chart illustrating trend and Fibonacci retracement levels.
Conclusion
The Oracle Corporation has experienced a solid uptrend, as evidenced by the significant rise in stock prices from November 2024 to September 2025. The price positioning around key Fibonacci levels may provide support for further gains, especially considering the stock is currently near the 0.618 retracement, often a strong support within a bullish market. While market conditions remain favorable, potential investors should remain vigilant for any abrupt market changes. The strong technical setup presents both opportunities for sustained gains and risks associated with market volatility. Keeping a close eye on market developments will be essential for analysts to make informed decisions.
Smart Data Insight
Master the Perfect Entry & Exit for this Stock
Don't leave your profits to chance. Historically, this stock follows specific seasonal patterns that institutional traders use to maximize returns.
- ✅ Identify the "Golden Buying Window"
- ✅ Avoid high-risk correction cycles
- ✅ Backtested data from the last 20+ years