September 26, 2025 a 03:15 pm
ORCL: Fibunacci Analysis - Oracle Corporation
Oracle Corporation has shown robust growth in its stock value over the past few months. The company’s cloud offerings continue to appeal to a diverse set of industries worldwide. Despite potential market volatilities, Oracle’s strategic positioning in the cloud and enterprise solutions markets provides investors with solid growth insights.
Fibonacci Analysis
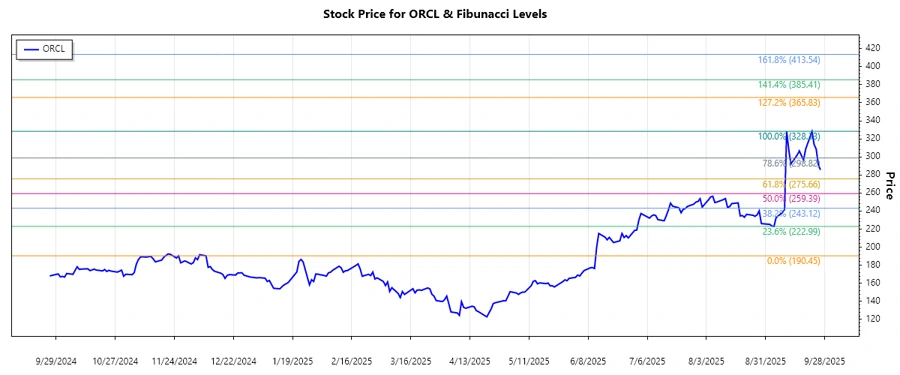
The examined period indicates a dominant uptrend for Oracle Corporation. Utilizing the highest and lowest points in the period, Fibonacci levels have been calculated to identify potential support or resistance zones.
| Start Date | End Date | High Price Date | High Price | Low Price Date | Low Price |
|---|---|---|---|---|---|
| 2024-12-09 | 2025-09-22 | 2025-09-10 | 328.33 | 2024-12-09 | 190.45 |
| Fibonacci Level | Price Level |
|---|---|
| 0.236 | 232.68 |
| 0.382 | 258.92 |
| 0.5 | 275.44 |
| 0.618 | 291.97 |
| 0.786 | 314.89 |
As of the last data point, the current price is 285.61. The price currently hovers around the 0.618 Fibonacci retracement level, indicating potential support at this level. This may suggest a continuation of the uptrend if the level holds.
Conclusion
Oracle Corporation’s stock shows a promising trend, supported by a strong organizational strategy and market positioning. While the market’s inherent volatility presents risk factors, Oracle’s diversified service offerings mitigate some of these concerns. The stable position around the 0.618 Fibonacci level indicates potential for continued upward momentum, although vigilant monitoring of market signals is advisable for stakeholders.
Smart Data Insight
Master the Perfect Entry & Exit for this Stock
Don't leave your profits to chance. Historically, this stock follows specific seasonal patterns that institutional traders use to maximize returns.
- ✅ Identify the "Golden Buying Window"
- ✅ Avoid high-risk correction cycles
- ✅ Backtested data from the last 20+ years