December 22, 2025 a 02:46 am

📊 ORCL: Dividend Analysis - Oracle Corporation
Oracle Corporation presents a unique dividend profile representative of its strategic financial operations. Despite a relatively low dividend yield, the company demonstrates significant capital efficiency in its dynamic sector. With a consistent dividend history spanning 18 years and periodic growth, Oracle reassures its investors of a stable cash distribution strategy, albeit with recent adjustments that warrant consideration.
🗣️ Overview
Oracle operates within a sector that prioritizes innovation and reinvestment, showcased through its strategic approach to dividends. The company's dividend yield stands at a modest 1.04%, but with a history of 18 years, this yield underscores a reliable, albeit conservative, income stream. The last recorded dividend adjustment in 2026 indicates strategic financial planning within challenging market conditions.
| Metric | Value |
|---|---|
| Sector | Technology |
| Dividend Yield | 1.04% |
| Current Dividend per Share | $1.70 |
| Dividend History | 18 years |
| Last Cut or Suspension | 2026 |
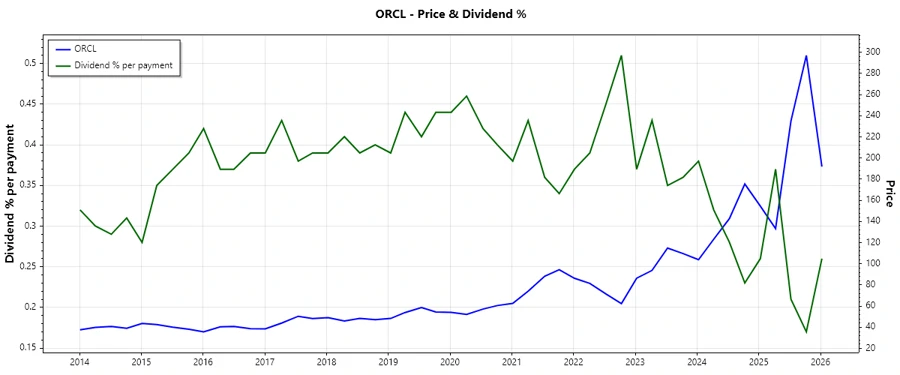
📈 Dividend History
The importance of examining Oracle's dividend history lies in assessing investor reliability and predicting future dividend behavior. A consistent payment history underlines Oracle's commitment to shareholder value amidst economic fluctuations.
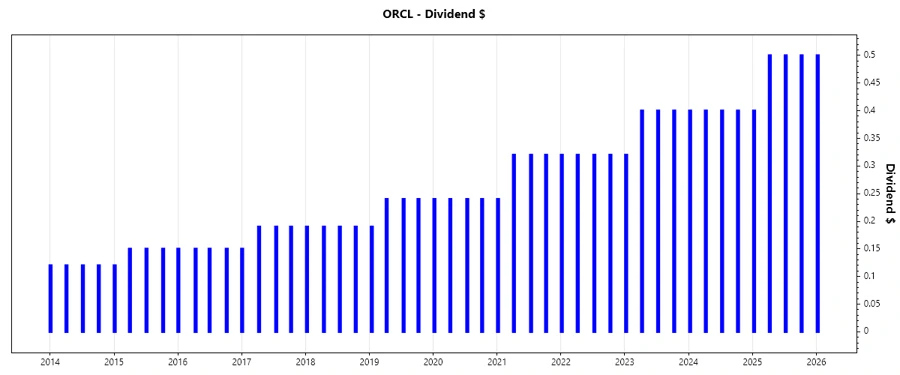
| Year | Dividend per Share (USD) |
|---|---|
| 2026 | 0.50 |
| 2025 | 1.90 |
| 2024 | 1.60 |
| 2023 | 1.52 |
| 2022 | 1.28 |
📉 Dividend Growth
Oracle's dividend growth is a vital indicator of potential future increases in cash returns to investors. The past 3-year growth of 0.10% and the 5-year growth of 0.12% suggest a strategically moderate growth rate that aligns with reinvestment into core operations and innovation.
| Time | Growth |
|---|---|
| 3 years | 0.10% |
| 5 years | 0.12% |
The average dividend growth is 0.12% over 5 years. This shows moderate but steady dividend growth.
✅ Payout Ratio
Understanding payout ratios is crucial as they measure the sustainability of dividends. With an EPS-based payout ratio at 31.37% and a troubling FCF-based ratio of -36.44%, Oracle portrays an aggressive capital allocation strategy. The EPS ratio signals a healthy scope for future increases, while the negative FCF suggests potential cash flow challenges impacting dividend viability if not corrected promptly.
| Key Figure | Ratio |
|---|---|
| EPS-based | 31.37% |
| Free Cash Flow-based | -36.44% |
Cashflow & Capital Efficiency
Oracle's cash flow dynamics and capital efficiency metrics are salient to its profitability and investor returns. Negative free cash flow yield highlights current cash flow constraints, while enriched earnings yield is a positive investor signal. The CAPEX to operating cash flow ratio portrays significant reinvestment into operations.
| Year | 2025 | 2024 | 2023 |
|---|---|---|---|
| Free Cash Flow Yield | -0.0009% | 3.67% | 2.97% |
| Earnings Yield | 2.70% | 3.25% | 2.98% |
| CAPEX to Operating Cash Flow | 1.02 | 0.37 | 0.51 |
| Stock-based Compensation to Revenue | 8.14% | 7.50% | 7.10% |
| Free Cash Flow / Operating Cash Flow Ratio | -0.019 | 0.632 | 0.493 |
The data portrays a focus on operational reinvestment and efficiency improvements. The negative free cash flow yield must be addressed to align with long-term capital efficiency and liquidity.
Balance Sheet & Leverage Analysis
Oracle's leverage ratios underscore its operational leverage and financial management strategy. The debt-to-equity ratio is notably high, reflecting an aggressive debt policy aimed at growth and value realization. The current ratio indicates short-term liquidity challenges.
| Year | 2025 | 2024 | 2023 |
|---|---|---|---|
| Debt-to-Equity | 5.09 | 10.85 | 84.33 |
| Debt-to-Assets | 0.618 | 0.670 | 0.673 |
| Debt-to-Capital | 0.836 | 0.916 | 0.988 |
| Net Debt to EBITDA | 3.90 | 3.93 | 4.31 |
| Current Ratio | 0.753 | 0.715 | 0.910 |
| Quick Ratio | 0.753 | 0.715 | 0.897 |
| Financial Leverage | 8.23 | 16.20 | 125.24 |
The balance sheet analysis indicates high leverage with potential financial risk reliant on growth strategy execution and market adaptability. Monitoring debt levels remains a priority.
Fundamental Strength & Profitability
Oracle demonstrates robust fundamental strength with positive profitability indicators. Return on equity and assets indicates effective income generation. Further, strong margin ratios project operational efficiency and value creation.
| Year | 2025 | 2024 | 2023 |
|---|---|---|---|
| Return on Equity | 60.84% | 120.26% | 792.45% |
| Return on Assets | 7.39% | 7.42% | 6.33% |
| Margins - Net | 21.68% | 19.76% | 17.02% |
| Margins - EBIT | 30.90% | 28.80% | 25.29% |
| Margins - EBITDA | 41.66% | 40.40% | 37.51% |
| Margins - Gross | 70.51% | 71.41% | 72.85% |
| R&D to Revenue | 17.18% | 16.83% | 17.26% |
These metrics validate Oracle's effective use of resources and strategic investment returns, vital for sustaining competitive advantage in a rapidly evolving sector.
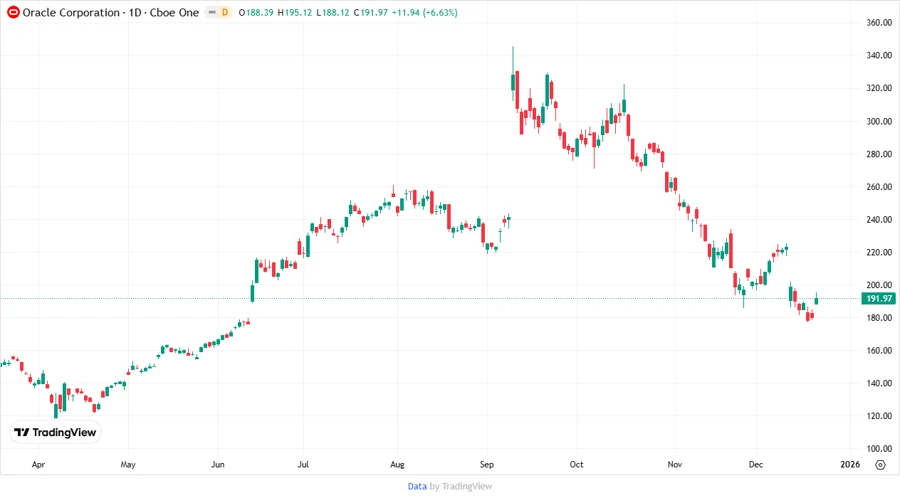
Price Development
Dividend Scoring System
| Criteria | Score | Score Bar |
|---|---|---|
| Dividend Yield | 2 | |
| Dividend Stability | 4 | |
| Dividend Growth | 3 | |
| Payout Ratio | 2 | |
| Financial Stability | 3 | |
| Dividend Continuity | 4 | |
| Cashflow Coverage | 3 | |
| Balance Sheet Quality | 2 |
Total Score: 23/40
Rating
Oracle Corporation exhibits a dividend profile characterized by stability and moderate growth potential amidst sector-specific challenges. While the yield is relatively low, faithful payment history and strategic growth initiatives signify long-term reliability. However, the balance sheet's high leverage ratio mandates a cautious outlook on financial stability. Investors should monitor Oracle's cash flow adaptability and market conditions for sustained dividend contributions.