February 05, 2026 a 04:44 pm
ON: Fibonacci Analysis - ON Semiconductor Corporation
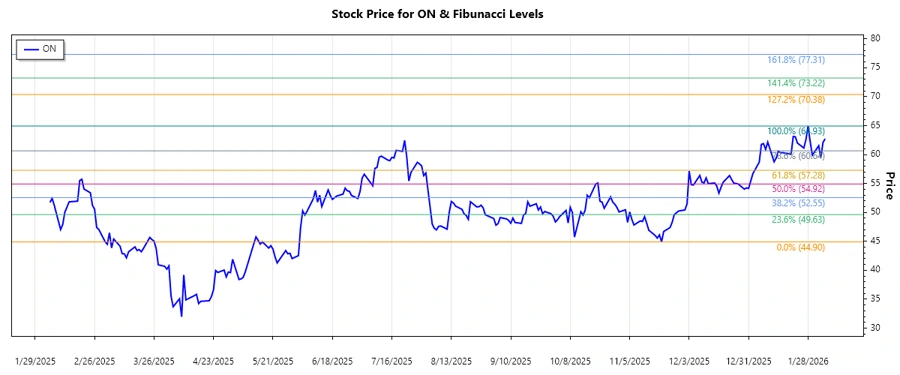
ON Semiconductor Corporation has showcased substantial growth over the analyzed period. The stock experienced a strong upward trend starting from November 2025 and peaking in February 2026. Its robust performance is driven by increasing demand in the automotive and industrial power sectors. Investors should closely monitor the current price movements as they may suggest potential opportunities or risks.
Fibonacci Analysis
| Details | Information |
|---|---|
| Start Date of Trend | 2025-11-20 |
| End Date of Trend | 2026-01-28 |
| Highest Price | 64.93 on 2026-01-28 |
| Lowest Price | 44.90 on 2025-11-20 |
| Fibonacci Level | Price |
|---|---|
| 0.236 | 59.95 |
| 0.382 | 56.75 |
| 0.5 | 54.89 |
| 0.618 | 53.03 |
| 0.786 | 50.53 |
The current price of 62.73 is above the 0.236 Fibonacci level, suggesting the stock may be forming a new trend or resuming its earlier bullish trajectory. Investors should consider the current position as a potential support for future growth.
Conclusion
ON Semiconductor's upward momentum signals a strong performance with consistent demand across key sectors such as automotive and sustainable energy. Despite recent fluctuations, the stock remains above critical Fibonacci levels, indicating a robust support structure for future gains. However, potential risks include market volatility and global economic pressures impacting semiconductor supply chains. For analysts, maintaining focus on Fibonacci levels and market trends is crucial for predicting future movements and potential resistance or support points.