September 21, 2025 a 10:15 am
ON: Fibonacci Analysis - ON Semiconductor Corporation
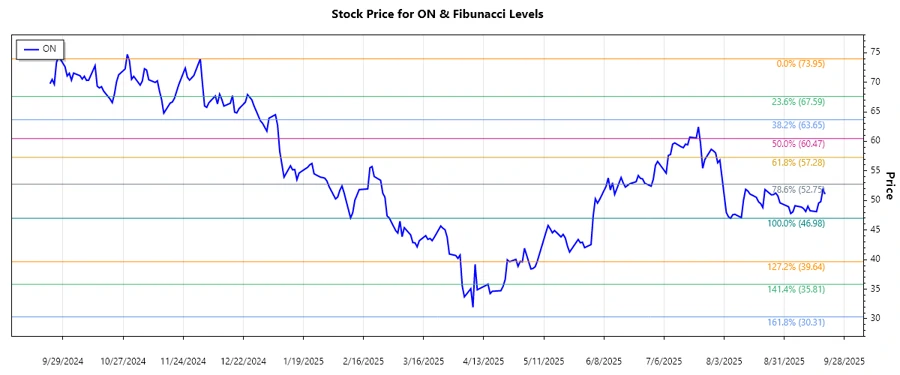
ON Semiconductor Corporation has demonstrated significant variations in its stock price, influenced by its innovations in the semiconductor industry and its pivotal role in automotive electrification and sustainable energy. Over recent months, the stock has experienced a distinct downtrend, highlighting investors' concerns potentially due to broader market conditions or sector-specific challenges. This trend sets the stage for a precise Fibonacci retracement analysis, identifying critical levels of potential support and resistance.
Fibonacci Analysis
| Trend Details | |
|---|---|
| Trend | Downward |
| Start Date | 2024-12-02 |
| End Date | 2025-09-19 |
| High Price (Date) | $73.95 (2024-12-02) |
| Low Price (Date) | $46.98 (2025-08-06) |
Fibonacci Retracement Levels
| Level | Price |
|---|---|
| 0.236 | $55.77 |
| 0.382 | $59.72 |
| 0.5 | $61.97 |
| 0.618 | $64.22 |
| 0.786 | $67.01 |
The current price of $51.07 suggests that the stock is below the 0.236 retracement level, potentially continuing its downward trend. A breakthrough above this level could indicate a reversal, turning the current resistance into a support level.
Conclusion
The analysis of ON Semiconductor Corporation stock reveals a notable downward trend with key Fibonacci retracement levels. Despite technological advancements, recent market pressures have led to a decline in stock prices. Analysts should be vigilant for a move above the 0.236 level, which could signal a potential reversal. The company’s future performance will likely be shaped by macroeconomic factors and its ability to capitalize on burgeoning markets like automotive electrification. Investors may find opportunities in volatility, but risks remain as the stock navigates its current bearish posture.
Smart Data Insight
Master the Perfect Entry & Exit for this Stock
Don't leave your profits to chance. Historically, this stock follows specific seasonal patterns that institutional traders use to maximize returns.
- ✅ Identify the "Golden Buying Window"
- ✅ Avoid high-risk correction cycles
- ✅ Backtested data from the last 20+ years