
July 21, 2026 a 03:15 pm
ODFL: Fibonacci Analysis - Old Dominion Freight Line, Inc.
Old Dominion Freight Line has shown remarkable resilience over recent months, displaying a robust upward trend in its stock price. Driven by its expansive logistics capabilities and a strategic focus on expedited deliveries, ODFL is positioned favorably in the less-than-truckload freight sector. Technical indicators suggest potential continued growth, although investors should remain vigilant for fluctuations in demand and fuel costs which could impact profitability.
Fibonacci Analysis
| Detail | Value |
|---|---|
| Start Date | 2025-11-21 |
| End Date | 2026-07-21 |
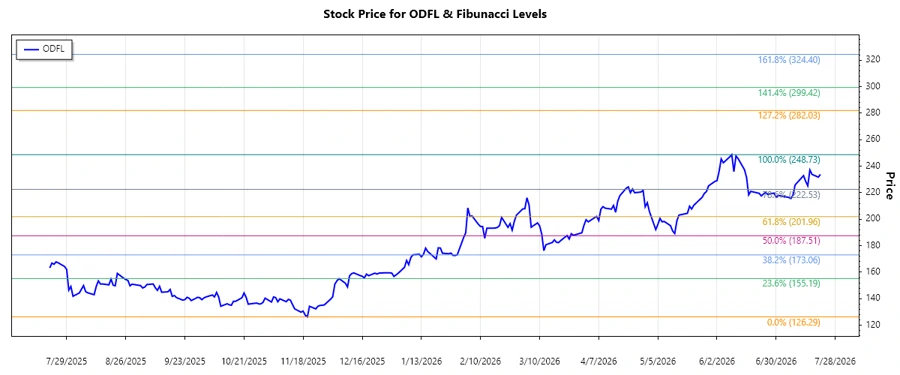
| High Point | $248.73 on 2026-06-09 |
| Low Point | $126.29 on 2025-11-20 |
| Fibonacci Levels |
|
| Current Price | $233.83 on 2026-07-21 |
| Current Retracement Zone | 0.786 |
The current stock price is within the 0.786 Fibonacci retracement level, indicating that a potential resistance level may be forming. Investors should watch for signs of support or reversal trends to confirm technical patterns.
Conclusion
ODFL's stock has experienced a significant upward trajectory, reflecting confidence in its operational strategy and market positioning. The proximity to the 0.786 Fibonacci level suggests potential resistance, although the stock's ability to surpass this landmark could signal continued bullish momentum. Conversely, failing to maintain within this zone may trigger corrections. Investors must evaluate broader market conditions and company fundamentals while considering historical retracement behaviors for strategic decision-making.
Smart Data Insight
Master the Perfect Entry & Exit for this Stock
Don't leave your profits to chance. Historically, this stock follows specific seasonal patterns that institutional traders use to maximize returns.
- ✅ Identify the "Golden Buying Window"
- ✅ Avoid high-risk correction cycles
- ✅ Backtested data from the last 20+ years