April 12, 2026 a 05:15 am
ODFL: Fibonacci Analysis - Old Dominion Freight Line, Inc.
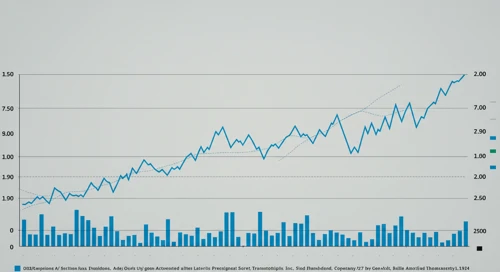
Old Dominion Freight Line, Inc. (ODFL) has demonstrated significant dynamics in its stock price as it navigates the competitive logistics industry. The company's robust service offerings and significant asset base, including extensive fleets and service centers, provide strong operational support. Recent trends indicate a notable period of price fluctuation, warranting a detailed technical analysis using Fibonacci levels to understand potential price movements. Investors should be aware of the current economic conditions that might influence these trends.
Fibonacci Analysis
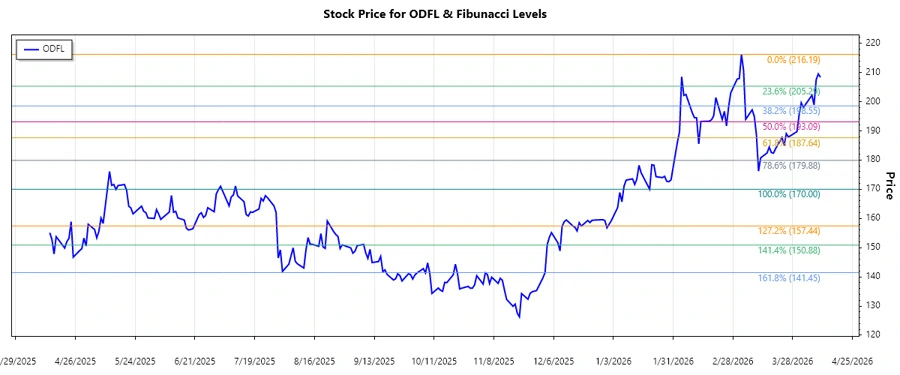
Analyzing the historical price data, the recent dominant trend observed is a downward movement from February 2026 to April 2026. Based on this trend, Fibonacci retracement levels have been calculated from the highest point at $216.19 on March 4, 2026, to the lowest point at $170.00 on January 20, 2026.
| Trend Period | High Date | High Price | Low Date | Low Price |
|---|---|---|---|---|
| Jan 2026 - Apr 2026 | 2026-03-04 | 216.19 | 2026-01-20 | 170.00 |
| Fibonacci Level | Price Level |
|---|---|
| 0.236 | 183.469 |
| 0.382 | 190.748 |
| 0.5 | 193.095 |
| 0.618 | 195.442 |
| 0.786 | 200.203 |
The current stock price as of April 10, 2026, is $208.35, which is moving beyond the 0.786 retracement level, suggesting that the stock has surpassed major retracement areas and might continue its upward movement. In technical terms, this could potentially be interpreted as the stock breaking past significant resistance levels, indicating a reversal or continuation of an uptrend.
Conclusion
Old Dominion Freight Line, Inc. presently shows signs of recovery from a downward trend, as evidenced by its surpassing the 0.786 Fibonacci retracement level. This progression could attract bullish investors anticipating a continued increase in stock prices. However, risks include the possibility of external market conditions and economic factors that could impact overall logistics demand. Analysts need to balance these considerations by closely monitoring both industry developments and broader economic indicators to make informed investment decisions.