November 11, 2025 a 05:15 am
ODFL: Fibonacci Analysis - Old Dominion Freight Line, Inc.
Old Dominion Freight Line, Inc., a leading LTL motor carrier, has shown resilience in its stock performance despite market volatility. The recent price movements indicate a potential downturn characterized by significant retracement zones. ODFL's strong market presence and service diversity continue to offer growth potential, yet careful monitoring of technical indicators is warranted as market dynamics evolve. Investors must consider the technical and fundamental aspects which may influence future price action.
Fibonacci Analysis
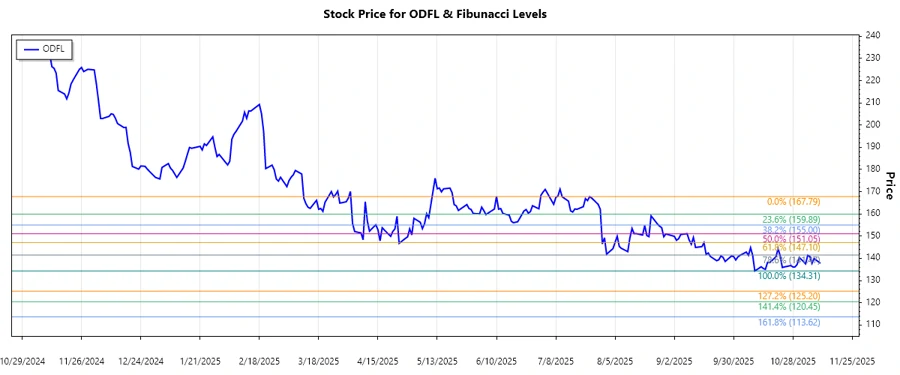
The analysis of ODFL's stock indicates a dominant downtrend from July 24, 2025, to November 10, 2025. The stock's high was noted at $167.79 on July 24, 2025, and reached a low of $134.31 on October 10, 2025. Based on this trend, we have calculated the Fibonacci retracement levels:
| Level | Price |
|---|---|
| 0.236 | 144.22 |
| 0.382 | 148.88 |
| 0.5 | 152.05 |
| 0.618 | 155.22 |
| 0.786 | 160.02 |
Currently, the stock is hovering around a price of $137.76, placing it below the 0.236 retracement level, indicating it is not within a retracement zone. This positions the stock in potential new support territory or suggests further downward momentum if support does not hold.
Conclusion
The technical analysis reveals ODFL is entrenched in a downtrend as of late 2025. The stock's movement away from Fibonacci retracement levels suggests possible new support testing. While strong fundamentals offer long-term bullish prospects, the current technical picture highlights caution for short-term investors. Analysts should watch for confirmation of support levels or potential further declines. Market conditions and external factors will likely dictate short-term fluctuations, but the company's robust operational framework remains an attractive attribute in the long term.
Smart Data Insight
Master the Perfect Entry & Exit for this Stock
Don't leave your profits to chance. Historically, this stock follows specific seasonal patterns that institutional traders use to maximize returns.
- ✅ Identify the "Golden Buying Window"
- ✅ Avoid high-risk correction cycles
- ✅ Backtested data from the last 20+ years