August 22, 2025 a 11:45 am

ODFL: Fibonacci Analysis - Old Dominion Freight Line, Inc.
Old Dominion Freight Line, Inc. (ODFL) has been a key player in the LTL (less-than-truckload) sector, offering reliable and efficient services across North America. Recently, the stock has experienced a notable downward trend, reflecting broader market conditions and sector-specific challenges. For technical analysts, this presents an opportunity to identify key support and resistance levels, utilizing tools such as Fibonacci Retracement. With recent data showing potential retracement, investors are keenly observing for signs of reversal or further decline.
Fibonacci Analysis
| Details | Value |
|---|---|
| Start Date of Trend | 2025-02-18 |
| End Date of Trend | 2025-08-21 |
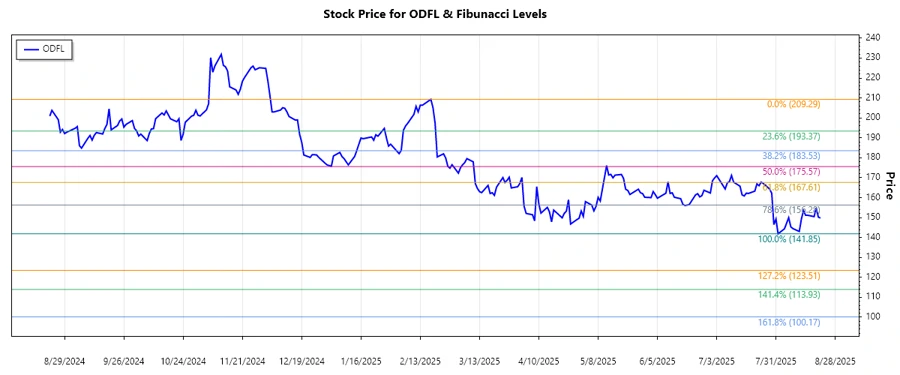
| High Price | $209.29 (2025-02-18) |
| Low Price | $141.85 (2025-08-01) |
Fibonacci Levels
| Level | Price |
|---|---|
| 0.236 | $157.79 |
| 0.382 | $170.35 |
| 0.5 | $175.57 |
| 0.618 | $180.79 |
| 0.786 | $188.43 |
The current price at $149.75 is not within any retracement zone. Technically, this suggests the stock may face resistance near $157.79, a key 23.6% Fibonacci level, before potentially moving higher to other retracement levels.
This chart visually represents the current Fibonacci retracement for ODFL.
Conclusion
Old Dominion Freight Line, Inc. faces several macroeconomic and sectoral challenges, with its recent downtrend signaling potential caution ahead. However, for traders eyeing bounce opportunities, Fibonacci levels provide a structured method to anticipate potential support areas. Given the stock's current position below the 23.6% retracement, it remains important to monitor for any bullish signals. Nonetheless, further declines could also present buying opportunities, provided the broader market sentiment stabilizes. Analysts will closely watch these Fibonacci levels as critical zones for understanding market behavior and investor sentiment in upcoming sessions.
Smart Data Insight
Master the Perfect Entry & Exit for this Stock
Don't leave your profits to chance. Historically, this stock follows specific seasonal patterns that institutional traders use to maximize returns.
- ✅ Identify the "Golden Buying Window"
- ✅ Avoid high-risk correction cycles
- ✅ Backtested data from the last 20+ years