June 17, 2025 a 03:15 pm
ODFL: Fibonacci Analysis - Old Dominion Freight Line, Inc.
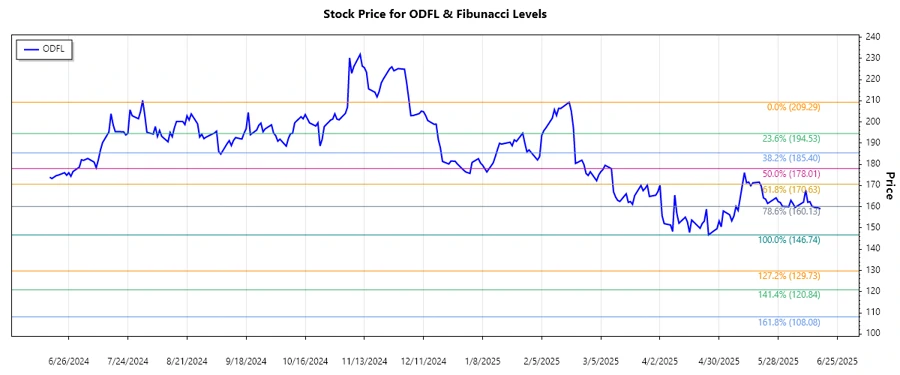
Old Dominion Freight Line, Inc. is exhibiting a significant downward trend over the recent months, leading to potential entry points based on technical analysis. With a recent high peaking in early March, the stock has since retraced and is currently experiencing volatility. This presents both opportunities and risks for traders and investors seeking to capitalize on short-term price movements.
Fibonacci Analysis
| Details | Information |
|---|---|
| Trend Start Date | 2025-03-10 |
| Trend End Date | 2025-06-17 |
| High Price & Date | $209.29 on 2025-02-18 |
| Low Price & Date | $146.74 on 2025-04-25 |
| Fibonacci Level | Price Level |
|---|---|
| 23.6% | $161.49 |
| 38.2% | $169.60 |
| 50% | $178.015 |
| 61.8% | $186.43 |
| 78.6% | $199.09 |
The current price is in the 23.6% retracement zone, indicating a potential minor recovery within a continuing downtrend. Analysts might interpret this as an area of temporary support, offering a cautious buying opportunity for those speculating on a short-term bounce.
Conclusion
The downward trend in Old Dominion Freight Line, Inc.’s stock has suggested sell-offs, and while it has found some support in the Fibonacci retracement zones, the overall trend continues downward. There is potential for a short-term upside, particularly if the stock breaks through additional resistance levels above the current retracement. However, traders should be vigilant of continued volatility, particularly given external market conditions that impact transportation and logistics sectors. Strategic investors might await further confirmation signals before committing to substantial position changes.
Smart Data Insight
Master the Perfect Entry & Exit for this Stock
Don't leave your profits to chance. Historically, this stock follows specific seasonal patterns that institutional traders use to maximize returns.
- ✅ Identify the "Golden Buying Window"
- ✅ Avoid high-risk correction cycles
- ✅ Backtested data from the last 20+ years