
July 06, 2026 a 03:31 pm
ODFL: Dividend Analysis - Old Dominion Freight Line, Inc.
Old Dominion Freight Line, Inc. demonstrates a consistent yet modest dividend yield. While the yield itself may not be considered high, the company's steady growth trajectory and stable financials place it in a solid position for both income-oriented and growth investors. Evaluating the company's payout ratios and cash flows also indicates a prudent and economically sound dividend policy.
📊 Overview
Old Dominion Freight Line operates in the transportation sector, known for cyclical growth patterns aligned with economic conditions. With a dividend yield of 0.48%, the company's current dividend per share is $1.12. The history of consistently increasing dividends over 10 years without any cutbacks exemplifies robust dividend stability.
| Metric | Value |
|---|---|
| Sector | Transportation |
| Dividend Yield | 0.48% |
| Current Dividend Per Share | $1.12 |
| Dividend History | 10 years |
| Last Cut or Suspension | None |
🗣️ Dividend History
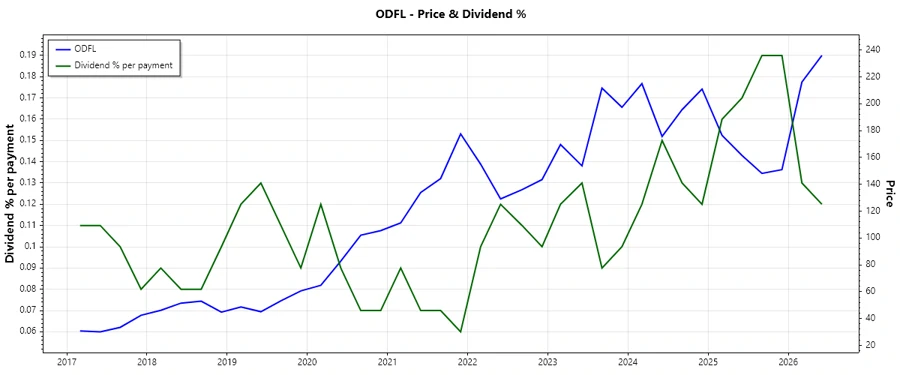
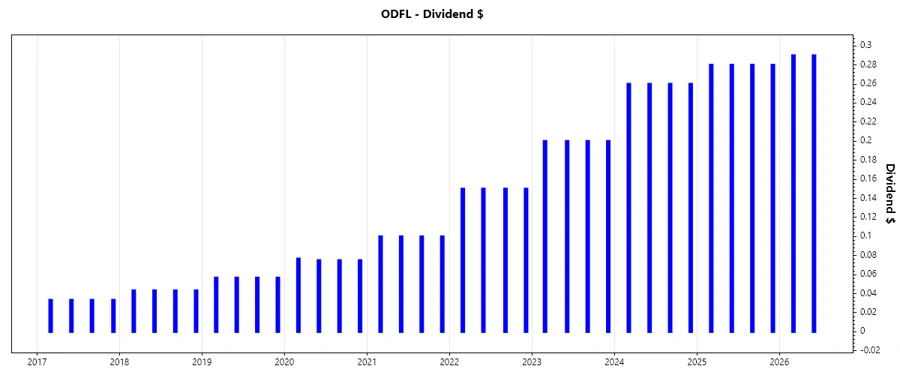
The dividend history of Old Dominion Freight Line is crucial for assessing its commitment to returning value to shareholders. The company showcases a history of regular dividend increments, a positive indicator for long-term investors.
| Year | Dividend Per Share (USD) |
|---|---|
| 2026 | $0.58 |
| 2025 | $1.12 |
| 2024 | $1.04 |
| 2023 | $0.80 |
| 2022 | $0.60 |
📈 Dividend Growth
Dividend growth provides insight into a company's future capacity to increase payouts. Analyzing the last 3 to 5 years' growth rates reveals a balanced and sustainable approach to increasing shareholder value.
| Time | Growth |
|---|---|
| 3 years | 23.13% |
| 5 years | 30.00% |
The average dividend growth is 30.00% over 5 years. This shows moderate but steady dividend growth.
📉 Payout Ratio
The payout ratio indicates the proportion of earnings paid out as dividends to shareholders, a critical factor in understanding dividend sustainability. Currently, the EPS-based ratio is 23.21%, and the FCF-based ratio is 22.94%, reflecting a conservative dividend policy providing future growth reinvestment opportunities.
| Key figure | Ratio (%) |
|---|---|
| EPS-based | 23.21% |
| Free Cash Flow-based | 22.94% |
With a payout ratio within the 20% range, Old Dominion displays a cautious and financially sound approach to dividend payouts, ensuring cash flow flexibility.
✅ Cashflow & Capital Efficiency
The company's cash flow metrics indicate stable cash generation and efficient capital use. Metrics such as Free Cash Flow Yield and CAPEX provide insights into liquid capital availability for continued reinvestment in the business.
| Year | 2025 | 2024 | 2023 |
|---|---|---|---|
| Free Cash Flow Yield | 2.90% | 2.34% | 1.83% |
| Earnings Yield | 3.11% | 3.12% | 2.79% |
| CAPEX to Operating Cash Flow | 30.29% | 46.49% | 48.26% |
| Stock-based Compensation to Revenue | 0.23% | 0.20% | 0.19% |
| Free Cash Flow / Operating Cash Flow Ratio | 69.71% | 53.51% | 51.74% |
These metrics collectively point towards effective cash flow management and strong capital efficiency, critical for long-term sustainability and growth reinvestment.
⚠️ Balance Sheet & Leverage Analysis
Understanding leverage and liquidity metrics like the current and quick ratios, debt-to-equity, and net debt to EBITDA help assess the company's financial health and risk.
| Year | 2025 | 2024 | 2023 |
|---|---|---|---|
| Debt-to-Equity | 3.28% | 3.96% | 1.88% |
| Debt-to-Assets | 2.53% | 3.06% | 1.45% |
| Debt-to-Capital | 3.18% | 3.81% | 1.84% |
| Net Debt to EBITDA | 1.23% | 3.13% | -17.94% |
| Current Ratio | 1.44 | 1.33 | 2.10 |
| Quick Ratio | 1.44 | 1.33 | 2.10 |
| Financial Leverage | 1.30 | 1.29 | 1.29 |
Metrics such as low debt ratios and high coverage ratios show Old Dominion’s low leverage, reflecting strong financial posture and low bankruptcy risk.
📈 Fundamental Strength & Profitability
Analyzing ROE, ROA, and profit margins provides a snapshot of profitability and operational efficiency. These metrics are key indicators of a business's ability to generate earnings.
| Year | 2025 | 2024 | 2023 |
|---|---|---|---|
| Return on Equity | 23.75% | 27.94% | 29.11% |
| Return on Assets | 18.32% | 21.60% | 22.49% |
| Net Profit Margin | 18.63% | 20.40% | 21.13% |
| EBIT Margin | 24.77% | 26.79% | 28.10% |
| EBITDA Margin | 31.41% | 32.72% | 33.63% |
| Gross Profit Margin | 32.15% | 34.79% | 35.32% |
Strong profitability metrics and efficient operations highlight the company's robust returns on equity and assets, underscoring financial health.
🔍 Price Development
✅ Dividend Scoring System
| Category | Score (1-5) | Visual Score |
|---|---|---|
| Dividend Yield | 2 | |
| Dividend Stability | 4 | |
| Dividend Growth | 3 | |
| Payout Ratio | 5 | |
| Financial Stability | 5 | |
| Dividend Continuity | 4 | |
| Cashflow Coverage | 4 | |
| Balance Sheet Quality | 5 |
Total Score: 32/40
📉 Rating
Old Dominion Freight Line, Inc. maintains a solid dividend framework underpinned by firm financial stability and operational efficacy. The moderate dividend yield is complemented by consistent and significant growth, making it an attractive option for investors focusing on both stability and potential capital appreciation. Recommended as a BUY for income-oriented portfolios with a long-term growth perspective.
Smart Data Insight
Master the Perfect Entry & Exit for this Stock
Don't leave your profits to chance. Historically, this stock follows specific seasonal patterns that institutional traders use to maximize returns.
- ✅ Identify the "Golden Buying Window"
- ✅ Avoid high-risk correction cycles
- ✅ Backtested data from the last 20+ years