May 15, 2026 a 12:46 pm

ODFL: Dividend Analysis - Old Dominion Freight Line, Inc.
Old Dominion Freight Line, Inc. presents an interesting case for dividend investors seeking stable income and growth. Despite a modest dividend yield, the company has demonstrated consistent and resilient earnings growth, which underpins its ability to continue rewarding shareholders. The company's robust financial health and history of dividend payments make it a promising candidate for dividend-focused portfolios.
📊 Overview
Old Dominion Freight Line operates in a stable sector with a concentrated focus on logistics and transportation, offering predictability in cash flows. A dividend yield of 0.52% suggests a conservative approach, opting to reinvest earnings into core operational growth, rewarding long-term investors. The last decade has showcased a strong commitment to dividend continuity.
| Metric | Details |
|---|---|
| Sector | Logistics and Transportation |
| Dividend yield | 0.52% |
| Current dividend per share | $1.1227 |
| Dividend history | 10 years |
| Last cut or suspension | None |
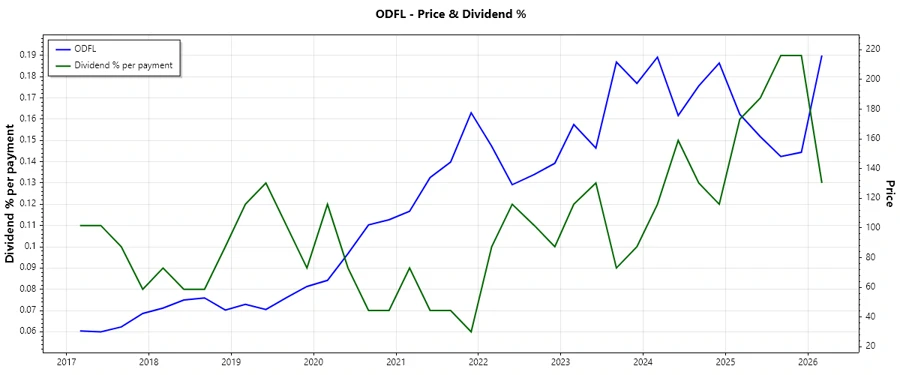
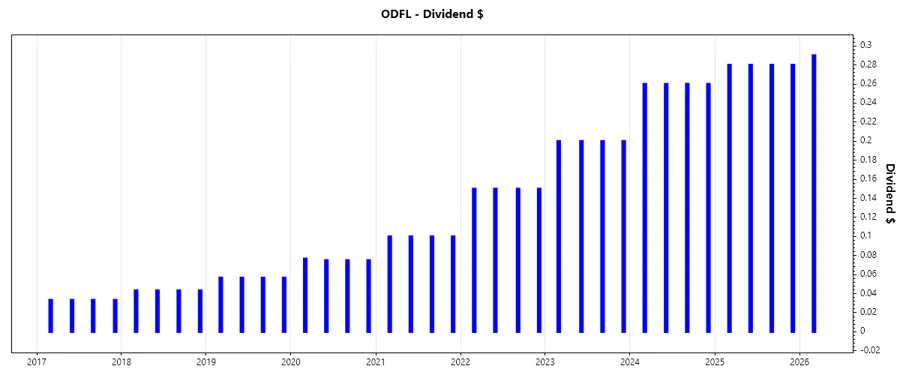
📈 Dividend History
The dividend history underscores Old Dominion's commitment to maintaining consistent shareholder returns. A steady increase in dividends is a strong sign of corporate health and financial discipline. This continuity gives investors confidence in the company’s financial strategy.
| Year | Dividend per Share (USD) |
|---|---|
| 2026 | 0.29 |
| 2025 | 1.12 |
| 2024 | 1.04 |
| 2023 | 0.80 |
| 2022 | 0.60 |
📊 Dividend Growth
A solid dividend growth rate is indicative of both the company's profitability and shareholder-friendly management. With a 3-year growth rate of 23.13% and a 5-year growth rate of 29.99%, Old Dominion has demonstrated its ability to enhance shareholder value progressively.
| Time | Growth |
|---|---|
| 3 years | 23.13% |
| 5 years | 29.99% |
The average dividend growth is 29.99% over 5 years. This shows moderate but steady dividend growth.
🧮 Payout Ratio
The payout ratio is a critical measure that helps investors understand the sustainability of the dividend payments. It reflects whether the dividends are adequately covered by the company's earnings and free cash flow. For Old Dominion, EPS-based payout ratio stands at 23.21%, and the free cash flow-based ratio is 22.94%, indicating a healthy capacity to maintain its dividend strategy.
| Key figure | Ratio |
|---|---|
| EPS-based | 23.21% |
| Free cash flow-based | 22.94% |
The payout ratios indicate a conservative approach, with ample room for reinvestment and dividend increases, underscoring sustainability.
🔍 Cashflow & Capital Efficiency
Efficient cash flow management and capital use are vital for sustaining and growing dividends. Old Dominion's free cash flow yield of 2.46% and an earnings yield of 2.43% highlights the company’s capacity to generate solid returns for investors. Metrics like CAPEX to Operating Cash Flow and Stock-based Compensation to Revenue further elucidate the capital deployment efficiency.
| Year | 2025 | 2024 | 2023 |
|---|---|---|---|
| Free Cash Flow Yield | 2.90% | 2.33% | 1.83% |
| Earnings Yield | 3.11% | 3.12% | 2.79% |
| CAPEX to Operating Cash Flow | 30.29% | 46.49% | 48.26% |
| Stock-based Compensation to Revenue | 0.23% | 0.20% | 0.19% |
| Free Cash Flow / Operating Cash Flow Ratio | 69.71% | 53.51% | 51.74% |
The company's ability to convert its operating cash flow to free cash flow, while maintaining a stable CAPEX investment, underscores its financial resilience and a disciplined capital allocation strategy.
⚙️ Balance Sheet & Leverage Analysis
The balance sheet is a crucial facet of financial stability. Indicators like debt-to-equity and current ratio provide insights into the firm's ability to meet its financial obligations. Old Dominion demonstrates prudence with a low debt-to-equity ratio, suggesting a conservative financial approach.
| Year | 2025 | 2024 | 2023 |
|---|---|---|---|
| Debt-to-Equity | 3.28% | 3.96% | 1.88% |
| Debt-to-Assets | 2.53% | 3.06% | 1.45% |
| Debt-to-Capital | 3.18% | 3.81% | 1.84% |
| Net Debt to EBITDA | 1.23% | 3.13% | -17.94% |
| Current Ratio | 1.44 | 1.33 | 2.10 |
| Quick Ratio | 1.44 | 1.33 | 2.10 |
| Financial Leverage | 1.30 | 1.29 | 1.29 |
Metrics reflect a sound balance sheet with disciplined debt management, minimizing leverage risks and maximizing liquidity.
💹 Fundamental Strength & Profitability
Profitability ratios and margins reveal the earning power of the company, essential for assessing its long-term viability. With ROE and margins being strong, the company is efficiently generating returns on its equity while maintaining robust profit margins.
| Year | 2025 | 2024 | 2023 |
|---|---|---|---|
| Return on Equity | 23.75% | 27.94% | 29.11% |
| Return on Assets | 18.32% | 21.60% | 22.49% |
| Net Margin | 18.63% | 20.40% | 21.13% |
| EBIT Margin | 24.77% | 26.79% | 28.10% |
| EBITDA Margin | 31.41% | 32.72% | 33.63% |
| Gross Margin | 32.15% | 34.79% | 35.32% |
| Research & Development to Revenue | 0.00% | 0.00% | 0.00% |
The strong margins across various measures suggest superior operational efficiency and competitive positioning in its sector, solidifying its fundamental strength.
📉 Price Development
🏆 Dividend Scoring System
| Criteria | Score | Score Bar |
|---|---|---|
| Dividend Yield | 3 | |
| Dividend Stability | 4 | |
| Dividend Growth | 5 | |
| Payout Ratio | 5 | |
| Financial Stability | 5 | |
| Dividend Continuity | 5 | |
| Cashflow Coverage | 4 | |
| Balance Sheet Quality | 5 |
Total Score: 36/40
🗣️ Rating
In conclusion, Old Dominion Freight Line, Inc. is an attractive investment for dividend-focused investors, exhibiting an excellent balance of financial health, sustainable payout ratios, and consistent dividend growth. The company's dedication to enhancing shareholder value while maintaining robust operational and financial metrics supports a strong buy recommendation.
Smart Data Insight
Master the Perfect Entry & Exit for this Stock
Don't leave your profits to chance. Historically, this stock follows specific seasonal patterns that institutional traders use to maximize returns.
- ✅ Identify the "Golden Buying Window"
- ✅ Avoid high-risk correction cycles
- ✅ Backtested data from the last 20+ years