May 14, 2026 a 11:33 am

ODFL: Dividend Analysis - Old Dominion Freight Line, Inc.
Old Dominion Freight Line, Inc. stands out as a robust choice for investors seeking consistent but moderate dividend growth. While the current dividend yield is modest at 0.52%, the company showcases a disciplined payout strategy with low payout ratios. The dividend history reflects resilience with no cuts in recent years, suggesting a strong commitment to shareholder returns.
📊 Overview
The transportation sector, known for its cyclical yet vital role in the economy, is where Old Dominion Freight Line operates. Their dividend yield of 0.52% may seem modest but aligns with their growth focus. With a current dividend per share of 1.12 USD and a history of 10 consecutive years of dividend payments, they exhibit solid stability.
| Metric | Value |
|---|---|
| Sector | Transportation |
| Dividend yield | 0.52% |
| Current dividend per share | 1.12 USD |
| Dividend history | 10 years |
| Last cut or suspension | None |
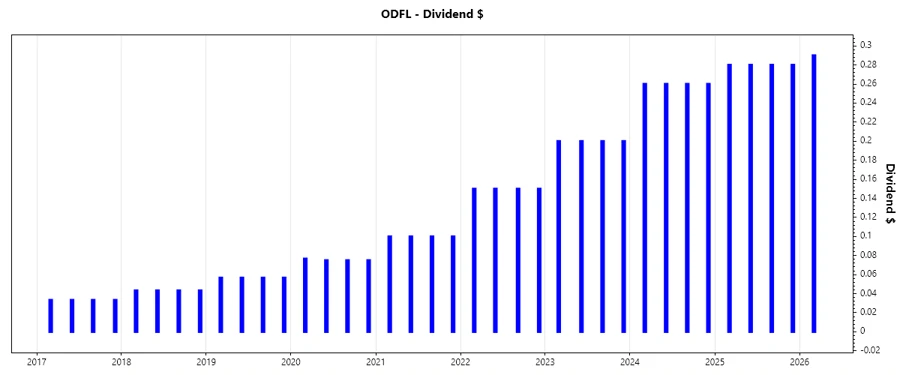
🗣️ Dividend History
Historical dividend trends provide insight into the company's commitment to sharing profits with shareholders. A stable or increasing dividend history signals financial health and strategic growth.
| Year | Dividend per Share (USD) |
|---|---|
| 2026 | 0.29 |
| 2025 | 1.12 |
| 2024 | 1.04 |
| 2023 | 0.80 |
| 2022 | 0.60 |
📈 Dividend Growth
Analyzing dividend growth rates is crucial for understanding potential future increases in income from dividend payments. This growth highlights Old Dominion's capacity to enhance shareholder value over the years.
| Time | Growth |
|---|---|
| 3 years | 23.13% |
| 5 years | 29.99% |
The average dividend growth is 29.99% over 5 years. This shows moderate but steady dividend growth.
✅ Payout Ratio
Payout ratios provide insight into how much of the company's earnings and cash flow are dedicated to dividends. Lower ratios suggest more room for dividend increases.
| Key Figure | Ratio |
|---|---|
| EPS-based | 23.21% |
| Free cash flow-based | 22.94% |
The EPS and FCF payout ratios at 23.21% and 22.94%, respectively, indicate a conservative dividend strategy, ensuring sustainability and potential for future hikes.
🔍 Cashflow & Capital Efficiency
Strong cash flow and capital efficiency are crucial for sustaining dividend payments and reinvesting in growth without accruing excessive debt.
| Metric | 2025 | 2024 | 2023 |
|---|---|---|---|
| Free Cash Flow Yield | 2.90% | 2.34% | 1.83% |
| Earnings Yield | 3.11% | 3.12% | 2.79% |
| CAPEX to Operating Cash Flow | 30.29% | 46.49% | 48.26% |
| Stock-based Compensation to Revenue | 0.24% | 0.20% | 0.19% |
| Free Cash Flow / Operating Cash Flow Ratio | 69.71% | 53.51% | 51.74% |
Satisfactory cash flow metrics support the firm's ability to maintain its dividend policy, while high capital efficiency underscores excellent operational management.
🔍 Balance Sheet & Leverage Analysis
A strong balance sheet with manageable leverage ratios signifies financial resilience and capacity to withstand economic challenges.
| Metric | 2025 | 2024 | 2023 |
|---|---|---|---|
| Debt-to-Equity | 3.28% | 3.96% | 1.88% |
| Debt-to-Assets | 2.53% | 3.06% | 1.45% |
| Debt-to-Capital | 3.18% | 3.81% | 1.84% |
| Net Debt to EBITDA | 0.012 | 0.031 | -0.179 |
| Current Ratio | 1.44 | 1.33 | 2.10 |
| Quick Ratio | 1.44 | 1.33 | 2.10 |
| Financial Leverage | 1.30 | 1.29 | 1.29 |
Stable leverage metrics coupled with strong liquidity positions reflect prudent financial management, promising lower risk during downturns.
🚀 Fundamental Strength & Profitability
Robust profitability ratios and efficient use of capital indicate a company capable of generating significant returns, a crucial factor for long-term dividend commitments.
| Metric | 2025 | 2024 | 2023 |
|---|---|---|---|
| Return on Equity (RoE) | 23.75% | 27.94% | 29.11% |
| Return on Assets (RoA) | 18.32% | 21.60% | 22.49% |
| Net Margin | 18.63% | 20.40% | 21.13% |
| EBIT Margin | 24.77% | 26.79% | 28.10% |
| EBITDA Margin | 31.41% | 32.72% | 33.63% |
| Gross Margin | 32.15% | 34.79% | 35.32% |
| R&D to Revenue | 0.00% | 0.00% | 0.00% |
Impressive profitability metrics, supported by efficient operational execution, indicate Old Dominion's potential to sustain its returns to shareholders.
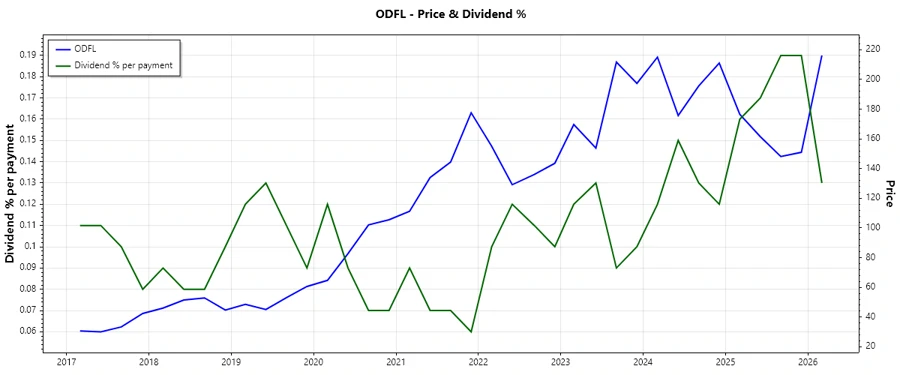
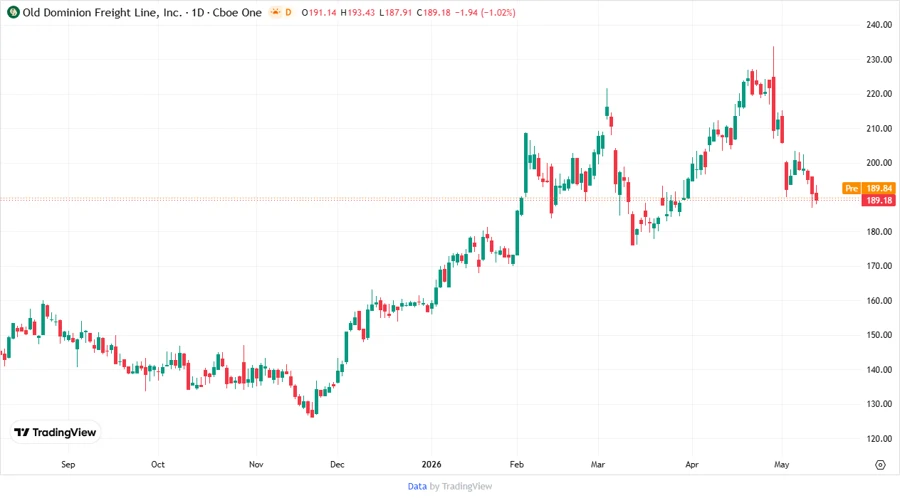
📉 Price Development
⭐ Dividend Scoring System
| Category | Score | Score Bar |
|---|---|---|
| Dividend yield | 3 | |
| Dividend Stability | 5 | |
| Dividend growth | 4 | |
| Payout ratio | 5 | |
| Financial stability | 5 | |
| Dividend continuity | 5 | |
| Cashflow Coverage | 4 | |
| Balance Sheet Quality | 5 |
Total Score: 36/40
🔔 Rating
Old Dominion Freight Line, Inc. presents a compelling option for dividend investors seeking stability with moderate growth. The company's strong balance sheet, disciplined payout ratios, and consistent cash flows ensure continued dividends, making it a worthy candidate for long-term portfolios.
Smart Data Insight
Master the Perfect Entry & Exit for this Stock
Don't leave your profits to chance. Historically, this stock follows specific seasonal patterns that institutional traders use to maximize returns.
- ✅ Identify the "Golden Buying Window"
- ✅ Avoid high-risk correction cycles
- ✅ Backtested data from the last 20+ years