January 25, 2026 a 02:46 am


ODFL: Dividend Analysis - Old Dominion Freight Line, Inc.
Old Dominion Freight Line, Inc. presents a robust dividend profile that is particularly appealing for long-term investors seeking moderate yet consistent dividend growth. With a stable payout ratio and a historical commitment to returning value to shareholders, the company demonstrates solid financial health, making it a credible candidate for dividend-focused portfolios. The absence of recent dividend cuts further reinforces the company's financial steadiness despite market volatilities.
📊 Overview
As a prominent entity in the transportation sector, Old Dominion Freight Line, Inc. exhibits a low but stable dividend yield of 0.74% aligned with its focus on growth reinvestment. Their current dividend per share stands at 1.04 USD, evidencing a gradual increase over their 9-year dividend history, with no cuts or suspensions, showcasing a strong commitment to shareholder returns.
| Category | Details |
|---|---|
| Sector | Transportation |
| Dividend Yield | 0.74% |
| Current Dividend Per Share | 1.04 USD |
| Dividend History | 9 years |
| Last Cut or Suspension | None |
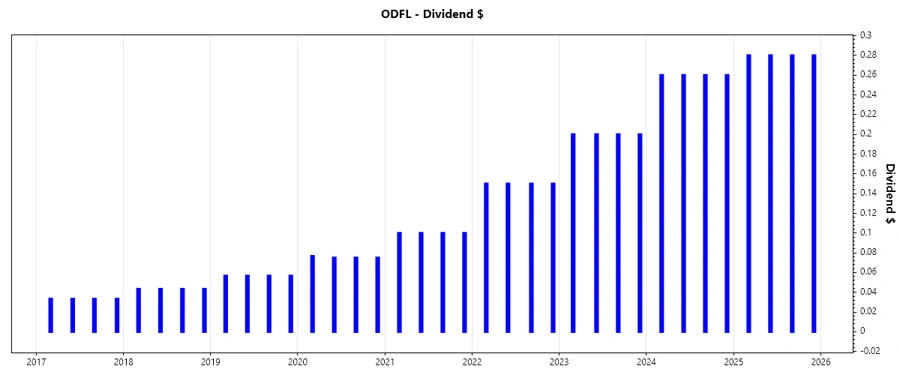
📈 Dividend History
The emphasis on consistent dividend payments underscores Old Dominion's commitment to maintaining investor confidence, critical for stabilizing its market position over economic cycles. This steadfast approach is vital in assessing its long-term investment viability.
| Year | Dividend Per Share (USD) |
|---|---|
| 2025 | 1.12 |
| 2024 | 1.04 |
| 2023 | 0.80 |
| 2022 | 0.60 |
| 2021 | 0.40 |
🗣️ Dividend Growth
Analyzing dividend growth is instrumental in understanding the company's ability to increase shareholder returns consistently. The growth trend reflects not only the company’s past profitability but also management’s confidence in continuous financial performance.
| Time | Growth |
|---|---|
| 3 years | 23.13% |
| 5 years | 29.98% |
The average dividend growth is 29.98% over 5 years. This shows moderate but steady dividend growth, suggesting a continued commitment to shareholder value enhancement.
📉 Payout Ratio
The payout ratio offers insights into a company’s dividend affordability relative to its earnings and cash flow. A balanced payout ratio allows room for future growth while ensuring a consistent dividend policy.
| Key Figure | Ratio |
|---|---|
| EPS-based | 20.71% |
| Free Cash Flow-based | 23.58% |
The EPS-based payout ratio of 20.71% and FCF-based payout ratio of 23.58% indicate a conservative dividend policy, leaving substantial cash for reinvestment or potential dividend increases.
✅ Cashflow & Capital Efficiency
Evaluating cashflow and capital efficiency helps determine how effectively the company is using its resources to generate cash and profit, essential for sustaining dividend payouts and ensuring future growth investments.
| 2024 | 2023 | 2022 | |
|---|---|---|---|
| Free Cash Flow Yield | 2.34% | 1.83% | 2.86% |
| Earnings Yield | 3.12% | 2.79% | 4.29% |
| CAPEX to Operating Cash Flow | 46.49% | 48.26% | 45.82% |
| Stock-based Compensation to Revenue | 0.20% | 0.19% | 0.25% |
| Free Cash Flow / Operating Cash Flow Ratio | 53.51% | 51.74% | 54.18% |
Old Dominion demonstrates strong cash flow stability, underscoring its ability to maintain dividends and invest in growth. The efficient use of capital resources enhances its operational leverage and profitability.
⚠️ Balance Sheet & Leverage Analysis
A healthy balance sheet and controlled leverage are crucial for assessing financial risk and ensuring long-term operational and financial flexibility.
| 2024 | 2023 | 2022 | |
|---|---|---|---|
| Debt-to-Equity | 3.96% | 1.88% | 2.74% |
| Debt-to-Assets | 3.06% | 1.45% | 2.07% |
| Debt-to-Capital | 3.81% | 1.84% | 2.66% |
| Net Debt to EBITDA | 0.03 | -0.18 | -0.04 |
| Current Ratio | 1.20 | 2.10 | 1.76 |
| Quick Ratio | 1.33 | 2.10 | 1.76 |
| Financial Leverage | 1.29 | 1.29 | 1.32 |
The conservative debt ratios and substantial liquidity indicate a robust balance sheet, minimizing potential risks related to financial stress and improving investment security.
📊 Fundamental Strength & Profitability
Understanding profitability and fundamental strength provides insights into the sustainability of dividend payments and future growth potential.
| 2024 | 2023 | 2022 | |
|---|---|---|---|
| Return on Equity | 27.94% | 29.11% | 37.70% |
| Return on Assets | 21.60% | 22.49% | 28.46% |
| Margins - Net | 20.40% | 21.13% | 22.00% |
| Margins - EBIT | 26.79% | 28.10% | 29.40% |
| Margins - EBITDA | 32.72% | 33.63% | 33.85% |
| Margins - Gross | 34.79% | 35.32% | 36.04% |
| R&D to Revenue | 0% | 0% | 0% |
Strong returns on equity and assets along with excellent profit margins emphasize Old Dominion's ability to generate value efficiently, supporting sustainable dividends and future growth prospects.
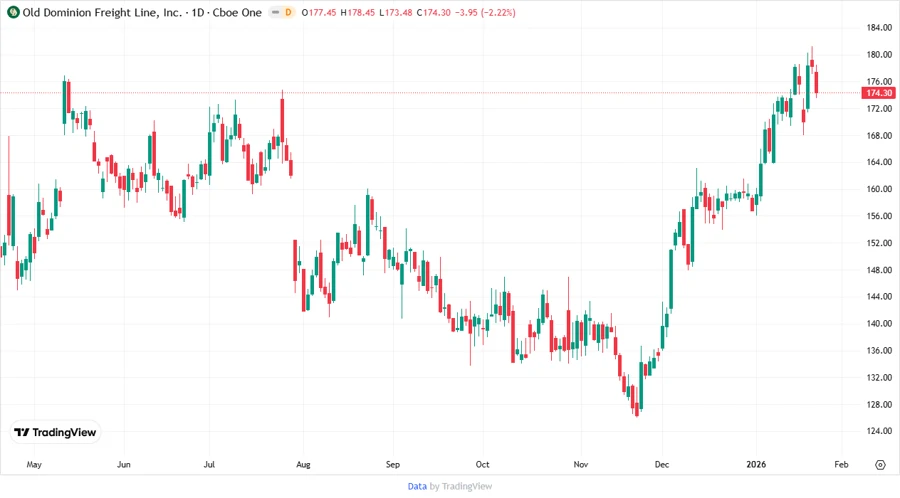
📈 Price Development
✅ Dividend Scoring System
| Category | Score | Graphical Representation |
|---|---|---|
| Dividend Yield | 3 | |
| Dividend Stability | 5 | |
| Dividend Growth | 4 | |
| Payout Ratio | 5 | |
| Financial Stability | 5 | |
| Dividend Continuity | 5 | |
| Cashflow Coverage | 4 | |
| Balance Sheet Quality | 5 |
Total Score: 36/40
🗣️ Rating
In conclusion, Old Dominion Freight Line, Inc. offers a compelling dividend profile characterized by moderate growth, superior financial stability, and impressive dividend consistency. These attributes make it a suitable candidate for investors seeking long-term dividend income and stability. The company's effective management of resources and commitment to shareholder returns underscores its potential as a reliable dividend stock.