December 18, 2025 a 07:46 am

ODFL: Dividend Analysis - Old Dominion Freight Line, Inc.
Old Dominion Freight Line, Inc. showcases a compelling dividend profile, characterized by moderate yields yet promising growth. The company has demonstrated reliable increases in dividend distributions over the past years, underscoring its commitment to delivering shareholder value. Furthermore, the firm’s disciplined financial management supports a sustainable dividend policy, making it an attractive prospect for income-focused investors.
📊 Overview
The assessment of Old Dominion Freight Line, Inc. reveals a disciplined dividend management strategy, primarily highlighted by its resilience and growth consistency in shareholder returns.
| Metric | Value |
|---|---|
| Sector | Transportation |
| Dividend Yield | 0.74% |
| Current Dividend per Share | $1.04 |
| Dividend History | 9 years |
| Last Cut or Suspension | None |
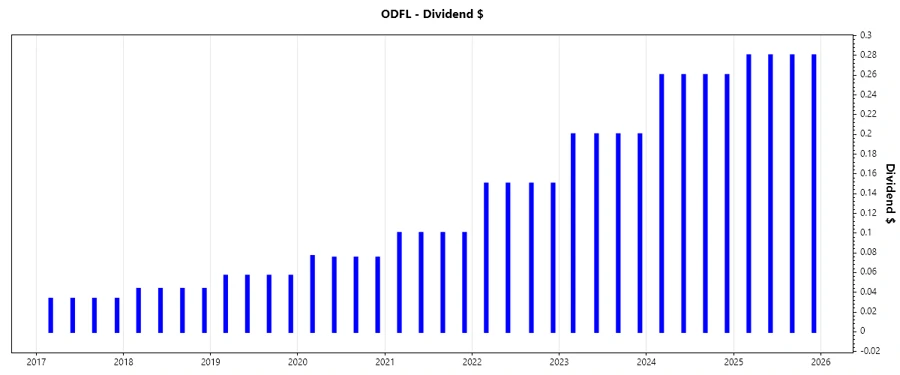
📈 Dividend History
The dividend history of Old Dominion Freight Line, Inc. showcases a reliable upward trajectory that is pivotal for evaluating long-term income potential. Investors can trust in the company’s ability to maintain and potentially enhance future payouts.

| Year | Dividend per Share (USD) |
|---|---|
| 2025 | 1.12 |
| 2024 | 1.04 |
| 2023 | 0.80 |
| 2022 | 0.60 |
| 2021 | 0.40 |
📈 Dividend Growth
Old Dominion Freight Line, Inc. demonstrates considerable dividend growth, a crucial attribute for long-term investors seeking enhanced income streams over time.
| Time | Growth |
|---|---|
| 3 years | 37.51% |
| 5 years | 35.62% |
The average dividend growth is 35.62% over 5 years. This shows moderate but steady dividend growth.
🔍 Payout Ratio
An analysis of the payout ratio provides insight into the sustainability of the company's dividend distributions, balancing reinvestment needs and shareholder returns.
| Key Figure | Ratio |
|---|---|
| EPS-based | 20.71% |
| Free Cash Flow-based | 23.58% |
The payout ratios of 20.71% (EPS) and 23.58% (FCF) underscore a conservative approach, suggesting ample room for future dividend increases while maintaining financial flexibility.
💰 Cashflow & Capital Efficiency
Evaluating cash flow and capital efficiency metrics reveals the company's effectiveness in generating and allocating capital. This also highlights its capacity to sustain and potentially enhance its dividend policy.
| Fiscal Year | 2024 | 2023 | 2022 |
|---|---|---|---|
| Free Cash Flow Yield | 2.34% | 1.83% | 2.86% |
| Earnings Yield | 3.12% | 2.79% | 4.29% |
| CAPEX/Operating Cash Flow | 46.48% | 48.26% | 45.82% |
| Stock-based Compensation/Revenue | 0.20% | 0.19% | 0.25% |
| FCF/Operating Cash Flow Ratio | 53.51% | 51.73% | 54.18% |
The company demonstrates robust cash flow stability and capital efficiency, with a consistent Free Cash Flow yield and efficient cash conversion processes, ensuring reliable support for dividends.
📉 Balance Sheet & Leverage Analysis
A thorough examination of leverage ratios and balance sheet strength is imperative to understand financial stability and liquidity, ensuring prudent debt management and cash position.
| Fiscal Year | 2024 | 2023 | 2022 |
|---|---|---|---|
| Debt-to-Equity | 3.96% | 1.88% | 2.74% |
| Debt-to-Assets | 3.06% | 1.45% | 2.07% |
| Debt-to-Capital | 3.81% | 1.84% | 2.66% |
| Net Debt to EBITDA | 0.03 | -0.18 | -0.04 |
| Current Ratio | 1.33 | 2.10 | 1.76 |
| Quick Ratio | 1.33 | 2.10 | 1.76 |
| Financial Leverage | 1.29 | 1.29 | 1.32 |
The company's balance sheet reflects sound financial health with minimal debt levels relative to assets and equity, underpinning its capacity to endure market fluctuations.
🗣️ Fundamental Strength & Profitability
Analyzing fundamental ratios furnishes insights into the operational efficiency and profitability, crucial for evaluating a company's long-term earning potential and competitive position.
| Fiscal Year | 2024 | 2023 | 2022 |
|---|---|---|---|
| Return on Equity | 27.94% | 29.11% | 37.70% |
| Return on Assets | 21.60% | 22.49% | 28.46% |
| Margins: Net | 20.40% | 21.13% | 22.00% |
| Margins: EBIT | 26.79% | 28.10% | 29.40% |
| Margins: EBITDA | 32.72% | 33.63% | 33.84% |
| Margins: Gross | 34.79% | 35.32% | 36.04% |
| R&D to Revenue | 0% | 0% | 0% |
The company's fundamental metrics illustrate strong profitability and efficiency, characterized by healthy return figures and robust margins, solidifying its competitive edge.
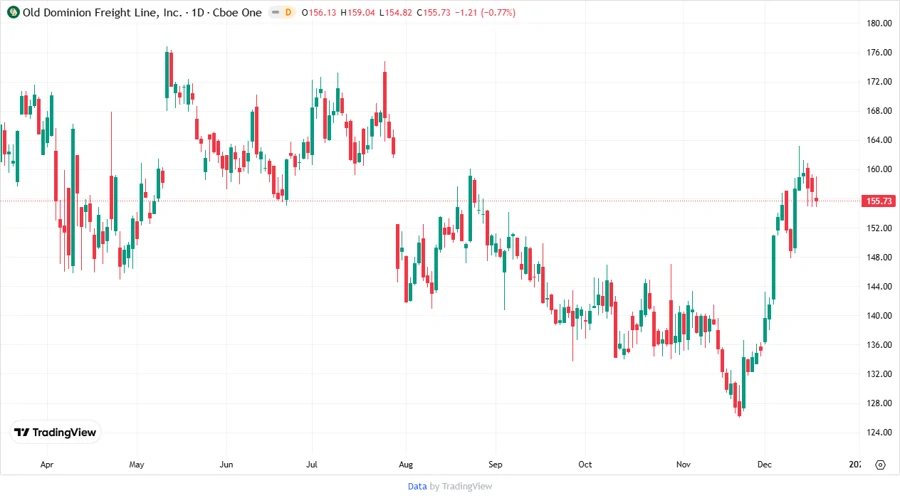
📈 Price Development
✅ Dividend Scoring System
| Criteria | Score | |
|---|---|---|
| Dividend Yield | 2 | |
| Dividend Stability | 4 | |
| Dividend Growth | 4 | |
| Payout Ratio | 5 | |
| Financial Stability | 5 | |
| Dividend Continuity | 4 | |
| Cashflow Coverage | 4 | |
| Balance Sheet Quality | 5 |
Total Score: 33/40
🗣️ Rating
Old Dominion Freight Line, Inc. exhibits a robust dividend profile underpinned by steady growth, significant financial stability, and strong payout discipline. While its yield may appeal to a niche of conservative investors seeking stability over high returns, the overall solid financial health makes it a commendable addition to long-term dividend growth portfolios.