May 30, 2025 a 07:32 am

ODFL: Dividend Analysis - Old Dominion Freight Line, Inc.
Old Dominion Freight Line, Inc. exhibits a strong position within its sector, demonstrating steady dividend growth alongside an impressive low payout ratio. The company's track record showcases a commitment to delivering shareholder value, underpinned by robust earnings and a disciplined financial strategy. In an environment marked by uncertainty, ODFL has maintained consistency in its dividend policies, amplifying its attractiveness for income-focused investors.
Overview 📊
Evaluating Old Dominion's dividend profile reveals its sector-specific resilience. Despite a modest dividend yield of 0.67%, the company has sustained a credible dividend history over 9 years with no records of cuts. This persistence underscores its financial discipline and operational efficiency.
| Details | Metrics |
|---|---|
| Sector | Transportation |
| Dividend yield | 0.67% |
| Current dividend per share | $1.04 |
| Dividend history | 9 years |
| Last cut or suspension | None |
Dividend History 🗣️
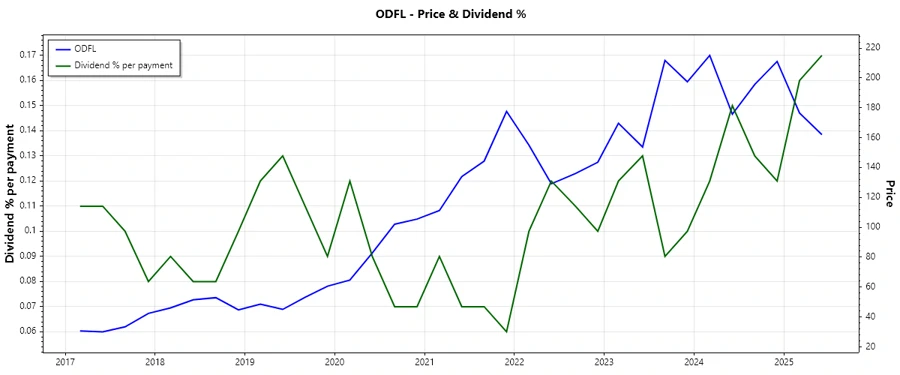
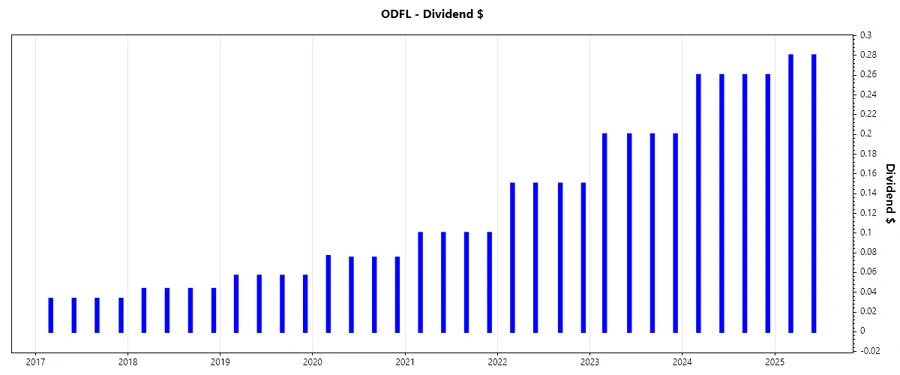
The dividend history of Old Dominion highlights steady annual growth and timely payments, reassuring investors of the company's reliability. This historical consistency fosters investor confidence, which is vital for long-term investment success.
| Year | Dividend per Share (USD) |
|---|---|
| 2025 | 0.56 |
| 2024 | 1.04 |
| 2023 | 0.80 |
| 2022 | 0.60 |
| 2021 | 0.40 |
Dividend Growth 📈
With a commendable 37.51% growth over the past three years and 35.62% over five years, Old Dominion's dividend growth is a testament to its effective revenue generation and cost management strategies. Such growth prospects are critical for compounding long-term wealth.
| Time | Growth |
|---|---|
| 3 years | 37.51% |
| 5 years | 35.62% |
The average dividend growth is 35.62% over 5 years. This shows moderate but steady dividend growth.
Payout Ratio ✅
The company's EPS-based payout ratio stands at 19.21%, while its free cash flow-based ratio is 26.38%. These figures are indicative of a sustainable dividend policy, affording the flexibility to undertake growth investments without endangering dividend payouts.
| Key figure | Ratio |
|---|---|
| EPS-based | 19.21% |
| Free cash flow-based | 26.38% |
The low payout ratios demonstrate financial prudence, allowing ample room for maintaining dividend distributions and reinvesting in growth avenues.
Cashflow & Capital Efficiency 🏦
Analyzing cash flows provides insights into the company’s ability to innovate and sustain capital projects. It also measures efficiency in transforming revenues into comprehensive cash returns.
| Year | 2024 | 2023 | 2022 |
|---|---|---|---|
| Free Cash Flow Yield | 2.34% | 1.83% | 2.86% |
| Earnings Yield | 3.12% | 2.79% | 4.29% |
| CAPEX to Operating Cash Flow | 46.48% | 48.26% | 45.82% |
| Stock Compensation to Revenue | 0.00% | 0.19% | 0.25% |
| FCF / Operating Cash Flow Ratio | 53.51% | 51.74% | 54.18% |
The data suggests a robust capability to generate operational cash flows, which are efficiently utilized for capital investments, underpinning strong future growth potential.
Balance Sheet & Leverage Analysis 📉
Effective balance sheet management highlights Old Dominion's fiscal discipline, crucial for maintaining financial health and investor trust.
| Year | 2024 | 2023 | 2022 |
|---|---|---|---|
| Debt-to-Equity | 1.41% | 4.71% | 2.74% |
| Debt-to-Assets | 1.09% | 3.64% | 2.07% |
| Debt-to-Capital | 1.39% | 4.50% | 2.66% |
| Net Debt to EBITDA | -0.03 | -0.12 | -0.04 |
| Current Ratio | NaN | 2.10 | 1.76 |
| Quick Ratio | 1.33 | 2.10 | 1.76 |
| Financial Leverage | 1.29 | 1.29 | 1.32 |
Low leverage ratios with consistent quick and current ratios showcase robust financial solvency, providing confidence in Old Dominion's long-term viability and operational risk resilience.
Fundamental Strength & Profitability 📊
Focusing on fundamental strength, Old Dominion positions itself as a profitability leader with efficient resource utilization.
| Year | 2024 | 2023 | 2022 |
|---|---|---|---|
| Return on Equity | 27.94% | 29.11% | 37.70% |
| Return on Assets | 21.60% | 22.49% | 28.46% |
| Net Margin | 20.40% | 21.13% | 22.00% |
| EBIT Margin | 26.79% | 28.10% | 29.40% |
| EBITDA Margin | 32.72% | 33.63% | 33.85% |
| Gross Margin | 34.79% | 35.32% | 36.04% |
| R&D to Revenue | 0.00% | 0.00% | 0.00% |
Excellent profit margins and strong returns on equity and assets indicate a well-managed company. Old Dominion's capabilities to convert revenues into substantial profits reflect a competitive operational advantage.
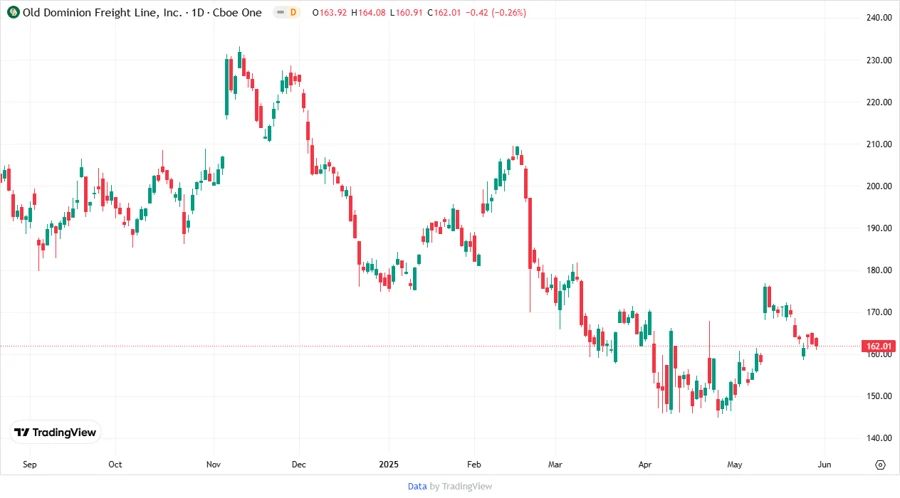
Price Development 📈
Dividend Scoring System 🏆
This scoring system evaluates various critical aspects of Old Dominion's dividend profile. Scores assigned denote competitive advantages amongst its peers.
| Category | Score | Score Bar |
|---|---|---|
| Dividend yield | 2 | |
| Dividend Stability | 5 | |
| Dividend Growth | 4 | |
| Payout Ratio | 5 | |
| Financial Stability | 5 | |
| Dividend Continuity | 5 | |
| Cashflow Coverage | 4 | |
| Balance Sheet Quality | 5 |
Total Score: 35/40
Rating 🌟
Old Dominion Freight Line, Inc. presents a robust dividend profile characterized by sustained growth, financial prudence, and operational efficiency. With a near-perfect stability and balance sheet quality score, it solidifies its position as a prudent choice for risk-averse and income-oriented investors. Despite a modest yield, the firm's storied consistency and prudent reinvestment strategies make it an attractive proposition for long-term investment considerations.
Smart Data Insight
Master the Perfect Entry & Exit for this Stock
Don't leave your profits to chance. Historically, this stock follows specific seasonal patterns that institutional traders use to maximize returns.
- ✅ Identify the "Golden Buying Window"
- ✅ Avoid high-risk correction cycles
- ✅ Backtested data from the last 20+ years