
November 08, 2026 a 04:28 am

NZDUSD: Trend and Support & Resistance Analysis
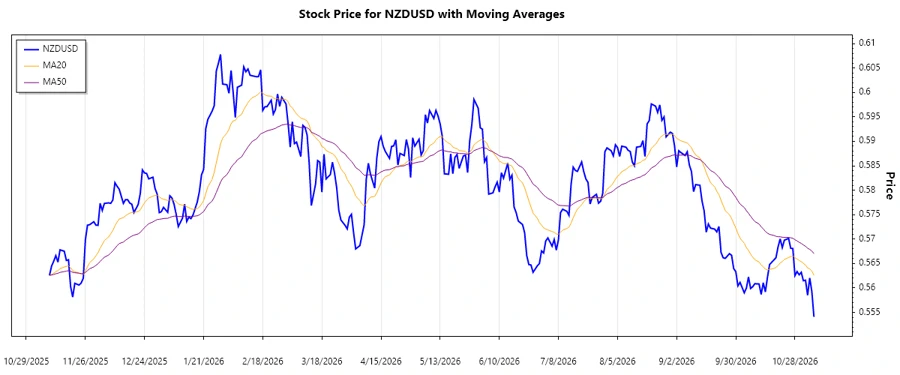
The NZDUSD currency pair has seen varied movements over the last several months. Analyzing recent price trends and moving averages, trading around support and resistance levels makes this pair intriguing for traders and analysts alike. The current trend, as indicated by EMAs, suggests potential opportunities amidst broader market dynamics.
Trend Analysis
| Date | Close Price | Trend |
|---|---|---|
| 2026-11-06 | 0.55408 | ▼ Abwärtstrend |
| 2026-11-05 | 0.55926 | ▼ Abwärtstrend |
| 2026-11-04 | 0.56205 | ▼ Abwärtstrend |
| 2026-11-03 | 0.55850 | ▼ Abwärtstrend |
| 2026-11-02 | 0.56158 | ▼ Abwärtstrend |
| 2026-11-01 | 0.56148 | ▼ Abwärtstrend |
| 2026-10-31 | 0.56320 | ▼ Abwärtstrend |
The analysis indicates a dominant downward trend, with EMA20 below EMA50, confirming sustained bearish momentum.
Support and Resistance
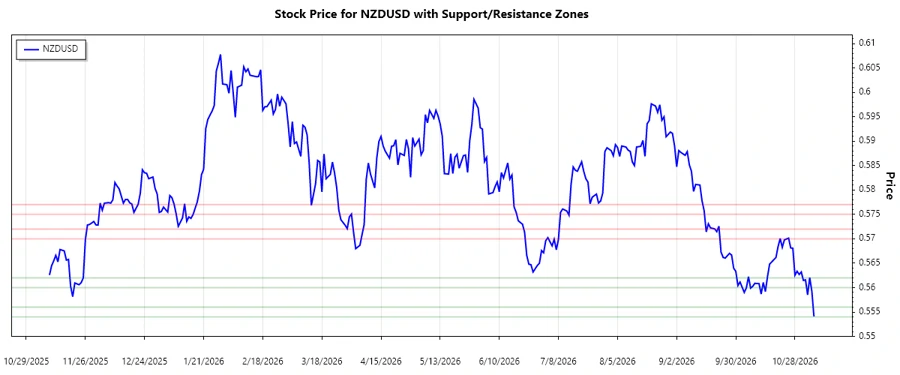
Based on recent price action, the following support and resistance zones have been identified:
| Zone Type | Zone From | Zone To |
|---|---|---|
| Support Zone 1 | 0.55400 | 0.55600 |
| Support Zone 2 | 0.56000 | 0.56200 |
| Resistance Zone 1 | 0.57000 | 0.57200 |
| Resistance Zone 2 | 0.57500 | 0.57700 |
The current price is hovering near the first support zone, indicating potential buying interest. The market might stabilize here or push lower if selling pressure persists.
Conclusion
NZDUSD displays a predominantly bearish trend as reflected by the EMA indicators, suggesting continued downward pressure. However, the identified support levels could provide temporary relief. Traders should remain cautious of potential recoveries if key resistance levels are breached, signalling a change in momentum. Continuous monitoring of global economic indicators will be vital for predicting short-term currency movements.
Smart Data Insight
Master the Perfect Entry & Exit for this Stock
Don't leave your profits to chance. Historically, this stock follows specific seasonal patterns that institutional traders use to maximize returns.
- ✅ Identify the "Golden Buying Window"
- ✅ Avoid high-risk correction cycles
- ✅ Backtested data from the last 20+ years