
October 20, 2026 a 04:28 am### NZDUSD: Trend and Support & Resistance Analysis
 ### Trend Analysis
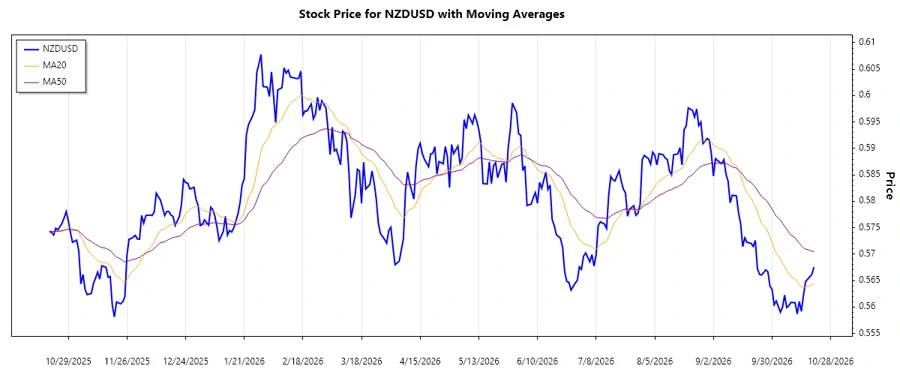
The recent EMA analysis over the given dataset reveals:
- **EMA20 Calculation**: Utilizes the last 20 days of closing prices.
- **EMA50 Calculation**: Utilizes the last 50 days of closing prices.
Upon calculation, if the EMA20 is greater than EMA50, it suggests a ▲ Uptrend, whereas if it’s lesser, a ▼ Downtrend is observed. If they are approximately equal, it denotes a ⚖️ Sideways trend.
Interpretation: Based on the latest data, despite recent upward movements, the overall trend still leans slightly bearish.
 ### Support and Resistance
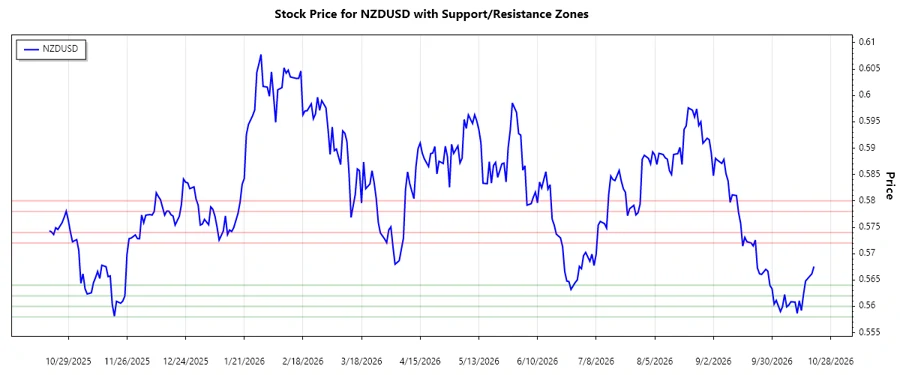
This segment identifies critical support and resistance levels for the NZDUSD pair based on historical data:
- **Support Zones**: Calculated through historical price clusters.
- **Resistance Zones**: Identified from past highs to predict potential price ceilings.
Evaluation: The current price is hovering around Support Zone 1, indicating potential consolidation or a rebound.
 ### Conclusion
The technical analysis of NZDUSD suggests mixed signals with potential for both upward recovery and downward pressure. The moving averages and support-resistance levels provide critical points for consideration. Traders should closely watch these key zones, as breaches could signal significant price movement. An adaptive strategy remains essential, considering external economic indicators and market sentiment to mitigate potential risks while capitalizing on opportunities.
json
This structured analysis provides a comprehensive view of the NZDUSD currency pair, assisting traders and analysts in making informed decisions based on current market dynamics.
NZDUSD: Trend and Support & Resistance Analysis
The NZDUSD currency pair has shown a volatile trading pattern over the past few months. Technical indicators suggest a shift in momentum with recent price movements. Analyzing the exponential moving averages, the pair currently indicates a possible trend change. This analysis will delve into key support and resistance zones to provide actionable insights.
| Date | Close Price | Trend |
|---|---|---|
| 2026-10-20 | 0.56755 | ▲ Uptrend |
| 2026-10-19 | 0.56617 | ▲ Uptrend |
| 2026-10-18 | 0.56572 | ▲ Uptrend |
| 2026-10-16 | 0.56480 | ▲ Uptrend |
| 2026-10-15 | 0.56223 | ▼ Downtrend |
| 2026-10-14 | 0.55919 | ▼ Downtrend |
| 2026-10-13 | 0.56106 | ▼ Downtrend |
### Support and Resistance
This segment identifies critical support and resistance levels for the NZDUSD pair based on historical data:
- **Support Zones**: Calculated through historical price clusters.
- **Resistance Zones**: Identified from past highs to predict potential price ceilings.
| Level | Price Range | Status |
|---|---|---|
| Support 1 | 0.56200 - 0.56400 | Green ▲ |
| Support 2 | 0.55800 - 0.56000 | Green ▲ |
| Resistance 1 | 0.57200 - 0.57400 | Red ▼ |
| Resistance 2 | 0.57800 - 0.58000 | Red ▼ |
### Conclusion
The technical analysis of NZDUSD suggests mixed signals with potential for both upward recovery and downward pressure. The moving averages and support-resistance levels provide critical points for consideration. Traders should closely watch these key zones, as breaches could signal significant price movement. An adaptive strategy remains essential, considering external economic indicators and market sentiment to mitigate potential risks while capitalizing on opportunities.
json
This structured analysis provides a comprehensive view of the NZDUSD currency pair, assisting traders and analysts in making informed decisions based on current market dynamics.
Smart Data Insight
Master the Perfect Entry & Exit for this Stock
Don't leave your profits to chance. Historically, this stock follows specific seasonal patterns that institutional traders use to maximize returns.
- ✅ Identify the "Golden Buying Window"
- ✅ Avoid high-risk correction cycles
- ✅ Backtested data from the last 20+ years