June 23, 2026 a 04:28 am

NZDUSD: Trend and Support & Resistance Analysis
The NZDUSD has experienced fluctuating trends over the past few months, revealing significant volatility. As we analyze the recent data, the currency is currently showing signs of a downward trend. Key support and resistance levels have emerged, offering crucial insights for traders and analysts involved in this currency pair.
Trend Analysis
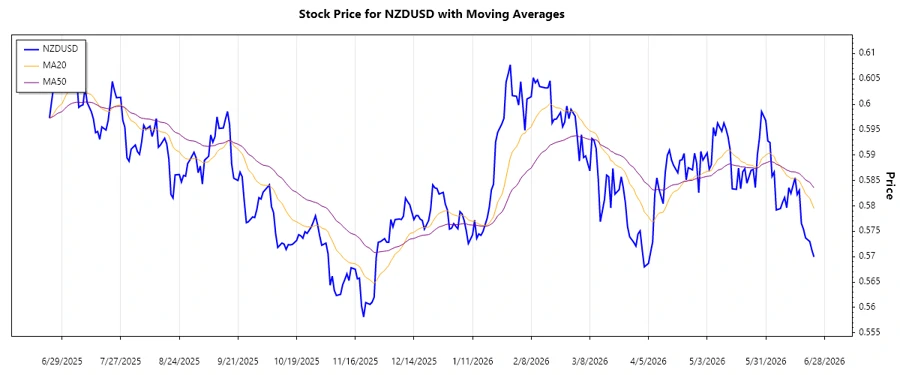
The most recent performance of the NZDUSD indicates a declining trend. By calculating the EMA20 and EMA50 using the closing prices, the trend can be characterized as a ▼ Abwärtstrend (Downward trend). Below is a table detailing the trend over the past seven days:
| Date | Close Price | Trend |
|---|---|---|
| 2026-06-23 | 0.56995 | ▼ |
| 2026-06-22 | 0.5713 | ▼ |
| 2026-06-21 | 0.57298 | ▼ |
| 2026-06-19 | 0.57369 | ▼ |
| 2026-06-18 | 0.5754 | ▼ |
| 2026-06-17 | 0.57655 | ▼ |
| 2026-06-16 | 0.58307 | ▲ |
Despite occasional temporary upward movements, the overall downtrend is evident and suggests a persistent bearish sentiment in the market.
Support and Resistance
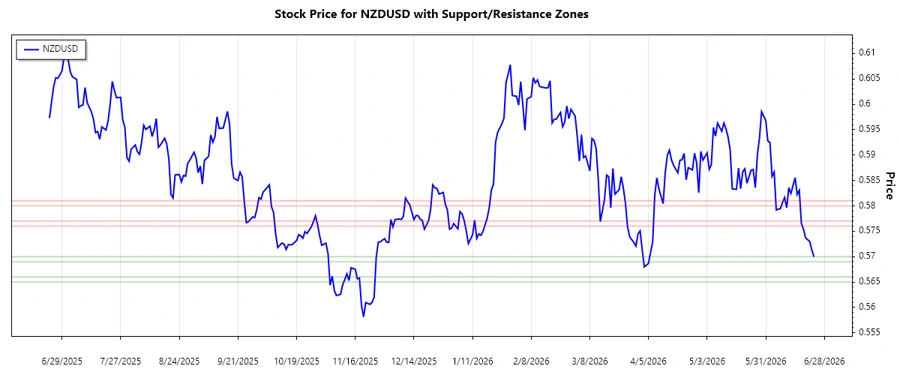
Analyzing the historical price data reveals critical support and resistance zones. These zones are calculated using the closing prices to identify potential reversal points:
| Zone | From | To |
|---|---|---|
| Support Zone 1 | 0.5690 | 0.5700 |
| Support Zone 2 | 0.5650 | 0.5660 |
| Resistance Zone 1 | 0.5760 | 0.5770 |
| Resistance Zone 2 | 0.5800 | 0.5810 |
Presently, the NZDUSD is approaching a significant support zone, indicating a possible bounce or break. The behavior in this zone is critical to determining future movements.
Conclusion
The NZDUSD currency pair is currently exhibiting bearish characteristics, with the potential to test key support levels. Traders should be cautious of the current downtrend, as further declines could ensue if support zones are breached. Conversely, a bounce from these levels might provide a short-term rally. Being aware of resistance levels is essential to gauge potential recovery points. This analysis highlights both the risks and opportunities present in the current trading environment for NZDUSD.
Smart Data Insight
Master the Perfect Entry & Exit for this Stock
Don't leave your profits to chance. Historically, this stock follows specific seasonal patterns that institutional traders use to maximize returns.
- ✅ Identify the "Golden Buying Window"
- ✅ Avoid high-risk correction cycles
- ✅ Backtested data from the last 20+ years