
May 30, 2026 a 04:28 am
NZDUSD: Trend and Support & Resistance Analysis
The NZDUSD currency pair has shown noticeable fluctuations over the recent months, with a mix of upward and downward trends. By analyzing the historical data, we can identify key support and resistance zones that have played crucial roles in the currency's movement. This analysis aims to provide insights into the technical aspects of NZDUSD, guiding traders in making informed decisions.
Trend Analysis
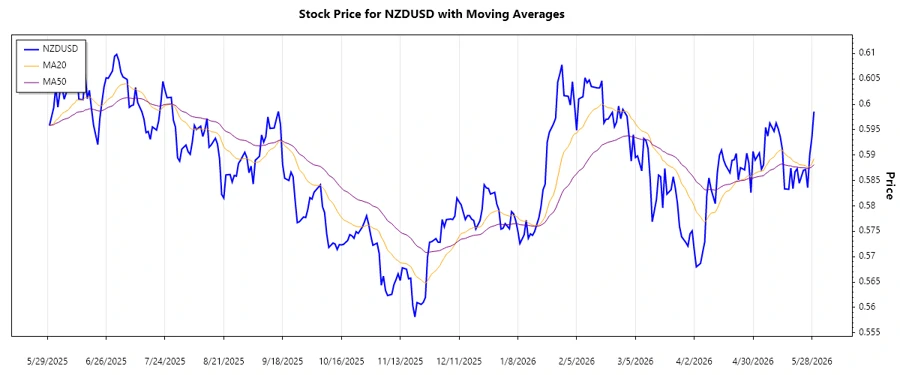
The NZDUSD currency pair has seen a varied range of movements over the analyzed period. By calculating the Exponential Moving Averages (EMA) for 20 and 50 days, we assess the trend direction effectively.
| Date | Closing Price | Trend |
|---|---|---|
| 29-05-2026 | 0.59858 | ▲ Uptrend |
| 28-05-2026 | 0.59342 | ▼ Downtrend |
| 27-05-2026 | 0.59009 | ▼ Downtrend |
| 26-05-2026 | 0.58359 | ▼ Downtrend |
| 25-05-2026 | 0.58717 | ▲ Uptrend |
| 24-05-2026 | 0.58702 | ▶ Sideways |
| 22-05-2026 | 0.58446 | ▶ Sideways |
Analysis based on EMA calculations shows a mix of trends, indicating a broader sideways movement with the potential for small uptrend or downtrend transitions. Technically, traders should look for breaks above or below the recent resistance and support to identify a new trend direction.
Support and Resistance
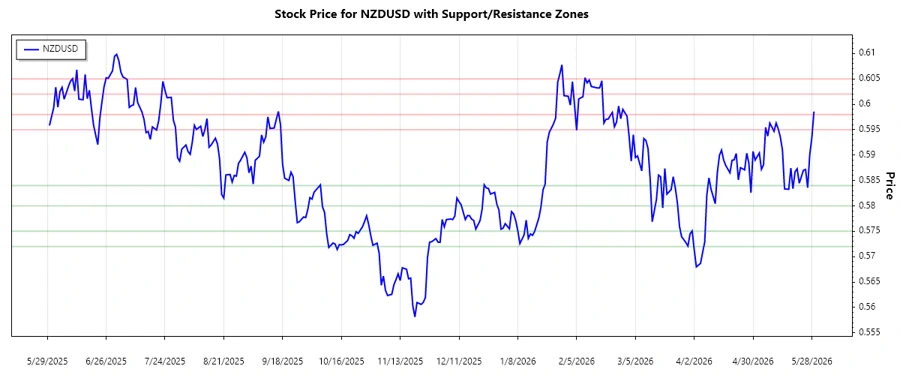
Identifying key support and resistance levels provides traders with crucial guides for entry and exit points.
| Zone Type | From | To |
|---|---|---|
| Support Level 1 | 0.57200 | 0.57500 |
| Support Level 2 | 0.58000 | 0.58400 |
| Resistance Level 1 | 0.59500 | 0.59800 |
| Resistance Level 2 | 0.60200 | 0.60500 |
The current price is near a resistance level of 0.59800, suggesting limited upward potential unless this level is broken convincingly. Traders might anticipate a pullback or wait for a breakout confirmation.
In conclusion, these support and resistance levels have been pivotal in guiding price movements, advising caution and strategic planning for traders.
Conclusion
In summary, NZDUSD presents multiple trading opportunities within its current trend framework. The interplay between support and resistance zones emphasizes the need for traders to focus on breakout potential for optimal trading strategies. While the short-term could see sideways movements, the potential for shifts should not be ignored, providing both risks and opportunities. It's essential for analysts to keep tracking these levels to adjust strategies according to market transitions.
This HTML content and JSON output summarize the technical analysis of NZDUSD based on the historical data provided. It can be integrated into an existing webpage and provides essential visual and analytical insights for mobile users.
Smart Data Insight
Master the Perfect Entry & Exit for this Stock
Don't leave your profits to chance. Historically, this stock follows specific seasonal patterns that institutional traders use to maximize returns.
- ✅ Identify the "Golden Buying Window"
- ✅ Avoid high-risk correction cycles
- ✅ Backtested data from the last 20+ years