February 13, 2026 a 04:28 am

NZDUSD: Trend and Support & Resistance Analysis
The NZDUSD currency pair has displayed noticeable fluctuations over recent months. Analyzing the historical data, the pair shows elements of a volatile market environment. Recent trends suggest a consolidation with key support and resistance levels guiding potential breakout or breakdown scenarios.
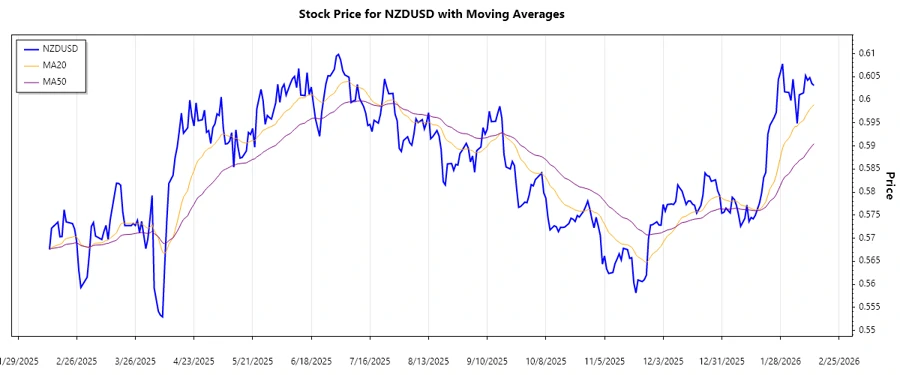
Trend Analysis
The trend analysis highlights the EMA20 and EMA50 interaction over the observed period. Calculations show a fluctuation between the two EMAs, indicating a mostly sideways trend with occasional bullish and bearish pressures.
| Date | Price | Trend |
|---|---|---|
| 2026-02-13 | 0.60311 | ⚖️ Sideways |
| 2026-02-12 | 0.60352 | ⚖️ Sideways |
| 2026-02-11 | 0.6048 | ▲ Uptrend |
| 2026-02-10 | 0.60423 | ▼ Downtrend |
| 2026-02-09 | 0.60524 | ▲ Uptrend |
| 2026-02-08 | 0.60149 | ▼ Downtrend |
| 2026-02-06 | 0.60107 | ▼ Downtrend |
The EMA20 and EMA50 crossover confirms occasional minor bullish movements within a predominant sideways trend. This requires monitoring to identify any substantial trend reversal.
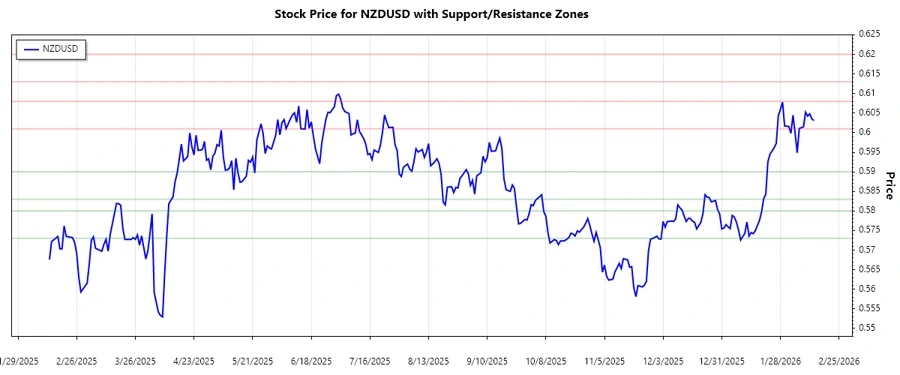
Support and Resistance
Recent price behavior identifies critical support and resistance zones. These zones play pivotal roles in influencing price movements by offering potential reversal or breakout points.
| Zone Type | From | To |
|---|---|---|
| Support Zone 1 | 0.58300 | 0.59000 |
| Support Zone 2 | 0.57300 | 0.58000 |
| Resistance Zone 1 | 0.60100 | 0.60800 |
| Resistance Zone 2 | 0.61300 | 0.62000 |
The current price is located near the upper boundary of the critical support zone between 0.60100 and 0.60800. The proximity to this level warrants close observation for potential shifts.
Conclusion
The NZDUSD has predominantly displayed a sideways trend, underpinned by transient shifts toward either direction. Analysts should closely watch defined support and resistance zones for precise entry and exit signals. The NZDUSD currency also suggests potential volatility, offering both risk and opportunity based on global economic conditions.