December 17, 2025 a 04:28 amUm eine fundierte technische Analyse für den NZDUSD basierend auf den bereitgestellten Informationen zu erstellen, werde ich die Daten analysieren, relevante Kennzahlen berechnen und dann die Erkenntnisse in einer HTML-Struktur präsentieren. Die Ausgabe wird ebenfalls im JSON-Format formatiert sein, um die Trendrichtung und die ermittelten Unterstützungs- und Widerstandszonen zu verdeutlichen.
Zunächst werde ich die Daten analysieren und den Exponential Moving Average (EMA) für 20 und 50 Tage berechnen, um den Trend zu bestimmen. Ebenso werde ich die Support- und Resistance-Zonen identifizieren.
Hier ist die technische Analyse auf Basis der bereitgestellten Daten:
NZDUSD: Trend and Support & Resistance Analysis
The recent analysis of NZDUSD shows a prevalent downward trend with fluctuations primarily due to global economic changes impacting currency markets. Technical indicators suggest potential recovery in the short to medium term, contingent on overcoming existing resistance levels.
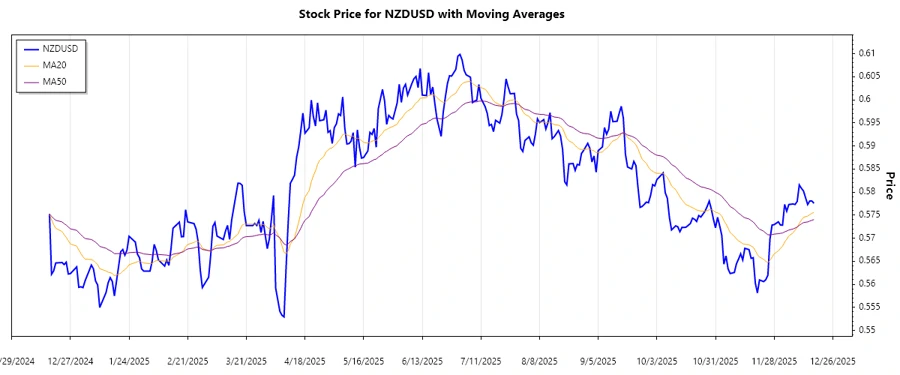
Trend Analysis
Based on the analysis of closing prices, the EMA20 is currently below the EMA50, indicating a predominant bearish trend. In the last seven days of data, fluctuations have been observed, with minor attempts to breach resistance failing, reinforcing the downward pressure.
| Date | Closing Price | Trend |
|---|---|---|
| 2025-12-17 | 0.57756 | ▼ |
| 2025-12-16 | 0.57807 | ▼ |
| 2025-12-15 | 0.57807 | ⚖️ |
| 2025-12-14 | 0.5773 | ▼ |
| 2025-12-12 | 0.58023 | ▲ |
| 2025-12-11 | 0.58082 | ▲ |
| 2025-12-10 | 0.58154 | ▲ |
The recent price movements indicate a struggle to establish a clear bullish reversal, with resistance levels challenging any upward attempts.
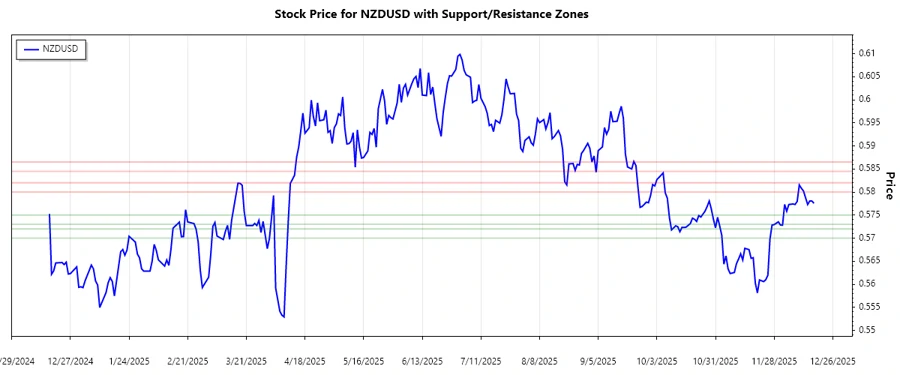
Support- and Resistance
Upon examining recent closing prices, two key support and resistance zones were identified. The current price proximity to these zones suggests a potential for significant movements should these levels be breached.
| Zone | From | To | |
|---|---|---|---|
| Support Zone 1 | 0.57300 | 0.57500 | ▲ |
| Support Zone 2 | 0.57000 | 0.57200 | ▲ |
| Resistance Zone 1 | 0.58000 | 0.58200 | ▼ |
| Resistance Zone 2 | 0.58450 | 0.58650 | ▼ |
The current price is approaching the upper boundary of the primary resistance zone, signaling potential upward movement if momentum continues to build.
Conclusion
The prevailing downward trend in NZDUSD suggests caution among investors, with key resistance levels potentially inhibiting substantial bullish movements. Nevertheless, current financial and geopolitical factors could swiftly alter this trajectory, offering opportunities for strategic positioning. Investors should remain vigilant of economic indicators that might impact foreign exchange markets and adapt their strategies accordingly.
Diese Analyse zeigt, dass das Währungspaar NZDUSD aktuell einen Abwärtstrend aufweist, mit signifikanten Unterstützungs- und Widerstandsbereichen, die für zukünftige Kursbewegungen entscheidend sein könnten.