May 30, 2025 a 04:28 amH1: NZDUSD: Trend and Support & Resistance Analysis
The NZDUSD mid-term outlook has shown some instability, reflecting a balance between bullish and bearish sentiments in the market. Through detailed analysis of historical closing prices, we aim to identify the prevailing trend direction as well as crucial support and resistance levels. This analysis will provide valuable insights for traders and analysts seeking to understand the potential movements in the currency pair.
Trend Analysis
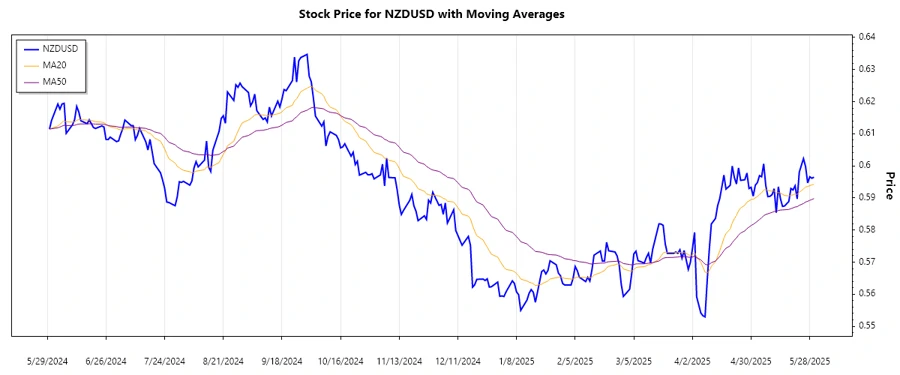
In the recent analysis of the NZDUSD daily closing prices, the Exponential Moving Averages (EMA) of 20 and 50 days have been calculated to recognize the current trend. The recent crossover patterns offer critical insights into the market's direction and potential reversals.
| Date | Close Price | Trend |
|---|---|---|
| 2025-05-30 | 0.59648 | ⚖️ |
| 2025-05-29 | 0.59613 | ⚖️ |
| 2025-05-28 | 0.5966 | ⚖️ |
| 2025-05-27 | 0.59468 | ⚖️ |
| 2025-05-26 | 0.59978 | ⚖️ |
| 2025-05-25 | 0.60226 | ⚖️ |
| 2025-05-23 | 0.59806 | ⚖️ |
The calculated EMAs indicate a neutral trend, suggesting an equilibrium between buying and selling pressures. Market participants should remain vigilant for potential shifts, possibly triggered by macroeconomic events or geopolitical developments.
Support- and Resistance
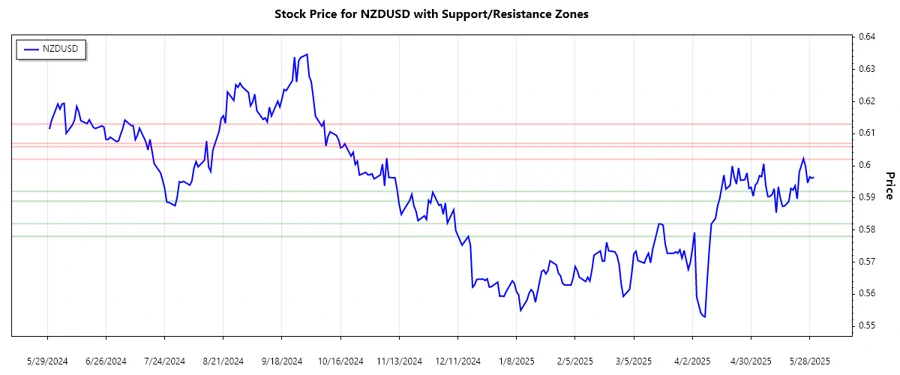
Analyzing the recent historical prices, key levels of support and resistance have been identified. These levels are crucial in forecasting potential price reversals or continuations, serving as psychological benchmarks for market participants.
| Zone | From | To |
|---|---|---|
| Resistance Zone 1 | ▼ 0.60200 | ▼ 0.60600 |
| Resistance Zone 2 | ▲ 0.60700 | ▲ 0.61300 |
| Support Zone 1 | ▼ 0.59200 | ▼ 0.58900 |
| Support Zone 2 | ▲ 0.58200 | ▲ 0.57800 |
Currently, the NZDUSD is trading close to the lower resistance zone suggesting an upcoming challenge against selling pressure. A breakthrough past this resistance could signal a potential bullish movement.
Conclusion
In conclusion, the NZDUSD currently exhibits a neutral trend with potential resistance challenges at nearby levels. The balance between supply and demand signifies a cautious outlook. Traders should observe how the price reacts around the identified zones to formulate strategic entry and exit points. While economic data or central bank announcements could prompt price movements, diligent monitoring remains necessary to capitalize on trade opportunities and mitigate potential risks. The overall market sentiment alongside these technical levels will guide traders in decision-making processes.
Smart Data Insight
Master the Perfect Entry & Exit for this Stock
Don't leave your profits to chance. Historically, this stock follows specific seasonal patterns that institutional traders use to maximize returns.
- ✅ Identify the "Golden Buying Window"
- ✅ Avoid high-risk correction cycles
- ✅ Backtested data from the last 20+ years