
September 17, 2026 a 05:08 am

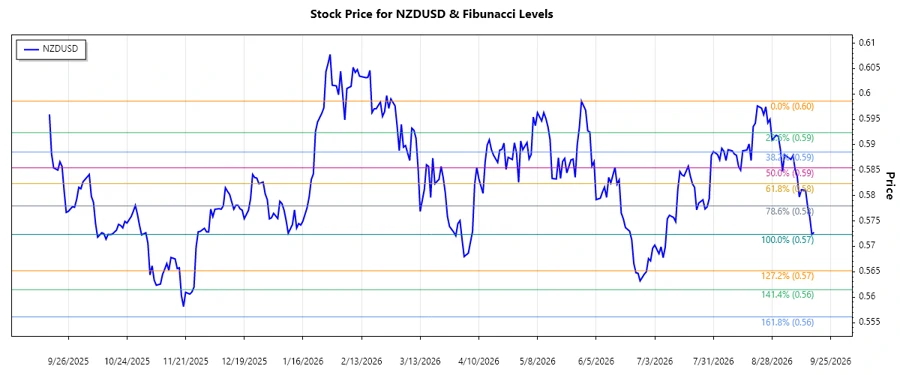
NZDUSD: Fibonacci Analysis
The NZDUSD pair has exhibited notable fluctuations recently, characterized by significant peaks and troughs. An understanding of the potential retracement levels can provide insights into future movements, helping analysts and traders make informed decisions. This pair's performance can be influenced by numerous factors, including interest rate differentials, commodity price shifts, and economic indicators. Technical analysis using Fibonacci retracement offers a structured way to predict potential support and resistance levels.
Fibonacci Analysis
| Aspect | Details |
|---|---|
| Trend Analysis Period | 2026-05-29 to 2026-09-17 |
| High Point (Price & Date) | $0.59858 on 2026-05-29 |
| Low Point (Price & Date) | $0.57233 on 2026-09-16 |
| Fibonacci Levels |
|
| Current Price and Retracement | Current price: $0.57276; Retracement Zone: None |
| Technical Interpretation | The current price is below the 23.6% retracement level, indicating potential further downside risk unless a reversal pattern emerges. Support is forthcoming near recent lows, while resistance levels can act as future hurdles if upward momentum resumes. |
Conclusion
The NZDUSD pair is currently in a downward trend, as evident by the Fibonacci analysis. While the exchange rate sits below the 23.6% retracement level, further declines might be on the horizon unless significant market catalysts alter the direction. Investors and traders should watch for indicators of potential reversal or additional bearish signals. Observing economic data from New Zealand and the U.S. will be vital. The pair could regain some traction if positive developments arise, but caution is advised as the current technical setup suggests continued pressure on the Kiwi.
### JSON Representation
Smart Data Insight
Master the Perfect Entry & Exit for this Stock
Don't leave your profits to chance. Historically, this stock follows specific seasonal patterns that institutional traders use to maximize returns.
- ✅ Identify the "Golden Buying Window"
- ✅ Avoid high-risk correction cycles
- ✅ Backtested data from the last 20+ years