December 07, 2025 a 05:08 am

NZDUSD: Fibonacci Analysis
The New Zealand Dollar to US Dollar (NZDUSD) currency pair has experienced fluctuations as influenced by economic indicators from both countries. Over recent months, it has shown resilience amidst global market turbulence, largely driven by interest rate differentials and economic policies. This technical analysis evaluates the most recent trending pattern in NZDUSD to gauge potential retracement levels that are essential for traders to determine support and resistance zones for future trades.
Fibonacci Analysis
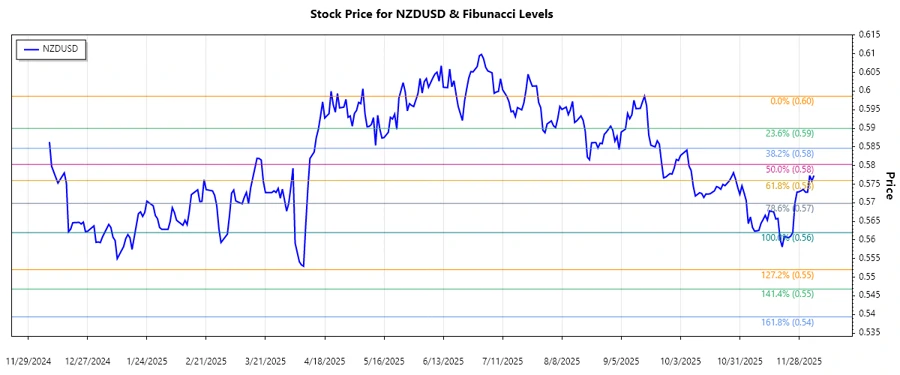
The latest dominant trend observed in NZDUSD is a downtrend. This pattern began in mid-September 2025 and extended until early December 2025. The Fibonacci retracement levels are calculated from the high point at the start of the trend to the low point at the end of the trend.
| Trend Period | High Point | Low Point | Current Price | Retracement Levels | Analysis |
|---|---|---|---|---|---|
| 2025-09-16 to 2025-12-05 | 0.59860 (2025-09-16) | 0.56197 (2025-11-25) | 0.5773 (2025-12-05) |
|
The current price is within the 0.382 retracement zone, suggesting a potential resistance around this level. |
In technical terms, the presence of NZDUSD within the 0.382 Fibonacci level signifies that this zone may act as resistance. If the price breaks above this level significantly, it could aim for the 0.5 level. Conversely, failure to breach could push it back toward lower supports.
Conclusion
The NZDUSD currency pair currently exhibits a cautious upward movement post hitting its recent low. Though it faces potential resistance at the current retracement level, breaking through could lead to further gains. Traders must remain vigilant as this pair is sensitive to macroeconomic factors from both New Zealand and the US. Overall, while technical indicators suggest resistance, external economic data can swiftly alter its course, urging analysts to remain focused on both technical and fundamental cues.