November 23, 2025 a 05:08 am

NZDUSD: Fibonacci Analysis
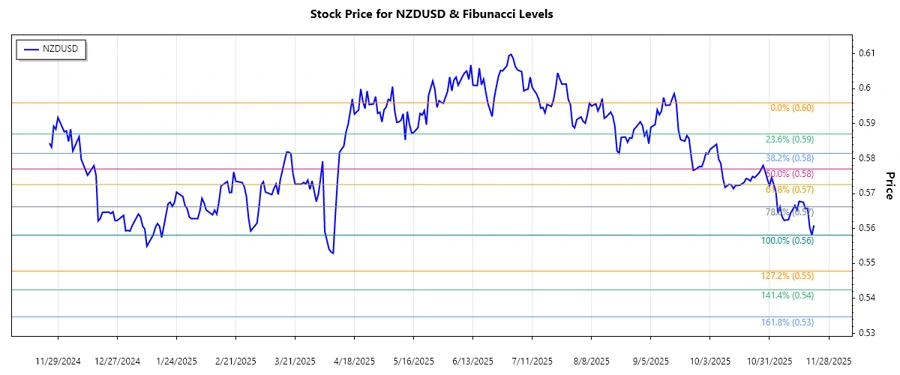
The NZDUSD pair has shown a significant downtrend in recent months, marked by decreasing highs and lows. Investors have noticed increased volatility due to geopolitical tensions and global economic shifts. The pair's current performance could suggest potential short-term recovery, yet economic indicators remain unpredictable.
Fibonacci Analysis
| Detail | Information |
|---|---|
| Trend Start Date | 2025-09-17 |
| Trend End Date | 2025-11-21 |
| Highest Price (Date) | 0.59599 (2025-09-17) |
| Lowest Price (Date) | 0.55813 (2025-11-20) |
| Fibonacci Level | Price |
|---|---|
| 23.6% | 0.56702 |
| 38.2% | 0.57360 |
| 50% | 0.57706 |
| 61.8% | 0.58052 |
| 78.6% | 0.58513 |
Currently, the NZDUSD is trading outside the standard Fibonacci retracement levels indicating potential for further downward movement before consolidation.
The technical analysis suggests the pair's inability to break above the 23.6% retracement level, which acts as a resistance, confirming a bearish trend.
Conclusion
The NZDUSD pair continues to present a bearish outlook with current trends in favor of further declines. While short-term recoveries may present themselves, the overall market sentiment remains bearish unless new economic data suggests otherwise. Forex traders should be cautious and monitor economic indicators closely as volatility poses risks and opportunities. Maintaining strict risk management strategies is paramount in navigating the current market conditions.
Smart Data Insight
Master the Perfect Entry & Exit for this Stock
Don't leave your profits to chance. Historically, this stock follows specific seasonal patterns that institutional traders use to maximize returns.
- ✅ Identify the "Golden Buying Window"
- ✅ Avoid high-risk correction cycles
- ✅ Backtested data from the last 20+ years