January 06, 2026 a 04:28 am
NZDJPY: Trend and Support & Resistance Analysis
The NZDJPY currency pair has recently shown distinct movement patterns, reflecting changes in investor sentiment and broader economic dynamics. By analyzing the data, we observe a significant shift in momentum that traders should be aware of. The technical indicators, especially the EMAs, point towards potential opportunities and risks for currency traders. Understanding these dynamics is crucial for strategically positioning trades.
Trend Analysis
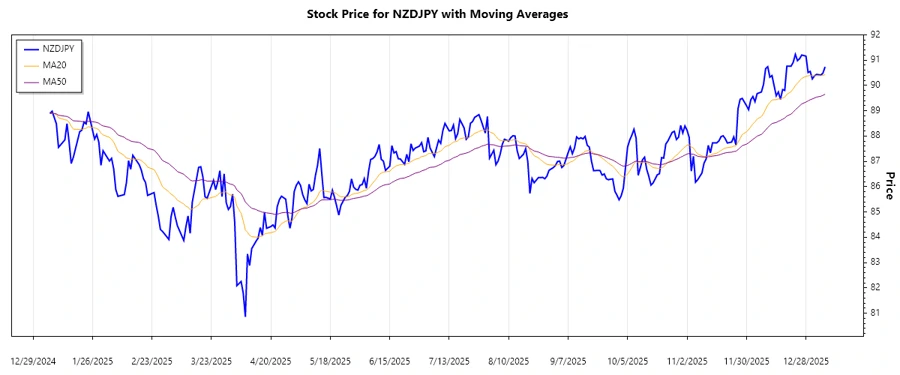
The historical data for NZDJPY reveals the following trends based on the calculated EMA20 and EMA50:
| Date | Close Price | Trend |
|---|---|---|
| 2026-01-06 | 90.736 | ▲ Uptrend |
| 2026-01-05 | 90.49 | ▲ Uptrend |
| 2026-01-04 | 90.411 | ▲ Uptrend |
| 2026-01-02 | 90.438 | ▲ Uptrend |
| 2026-01-01 | 90.378 | ▲ Uptrend |
| 2025-12-31 | 90.258 | ▲ Uptrend |
| 2025-12-30 | 90.554 | ▲ Uptrend |
The EMA calculations indicate a strong upward trend as the EMA20 remains above the EMA50. This suggests persistent bullish sentiment, potentially driven by favorable economic news or market dynamics.
Support and Resistance Analysis
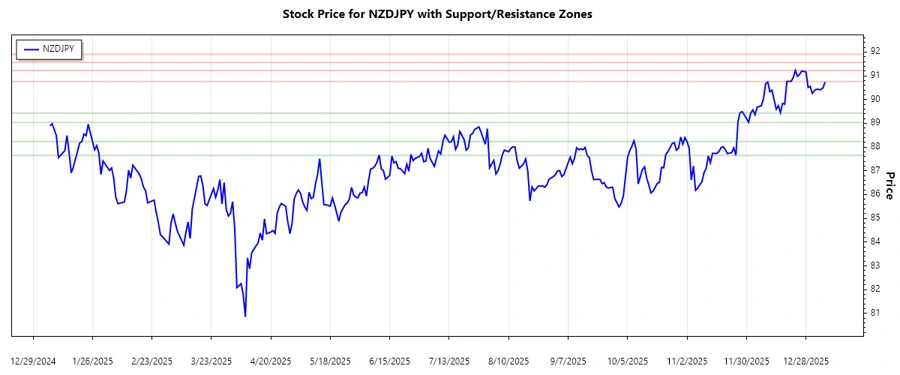
Analysis of the closing prices identifies key support and resistance zones:
| Zone Type | From | To |
|---|---|---|
| Support 1 | 87.65 | 88.23 |
| Support 2 | 89.04 | 89.43 |
| Resistance 1 | 90.76 | 91.22 |
| Resistance 2 | 91.56 | 91.90 |
The current close price resides near the identified resistance zone. Traders should monitor for potential breakout or retracement signals, which could indicate significant market movements.
Conclusion
The NZDJPY pair exhibits a steady upward trend driven by bullish sentiments, as derived from EMA analysis. Close proximity to resistance levels suggests an impending pivotal move. Traders should remain vigilant for a breakout scenario that may indicate upward momentum continuation, or a retracement that might provide sell signal opportunities. Ultimately, understanding both trend and support/resistance dynamics facilitates better-informed trading decisions amidst current market conditions.